")
")
Published in:
K. Kupka, M. Meloun: Data Analysis in the Chemical Laboratory. II. The End-Point Estimation in Instrumental Titrations by Nonlinear Regression, Anal. Chim. Acta, 429, 173 - 185 (2001) .
| Data108.xls |
Figures |
|
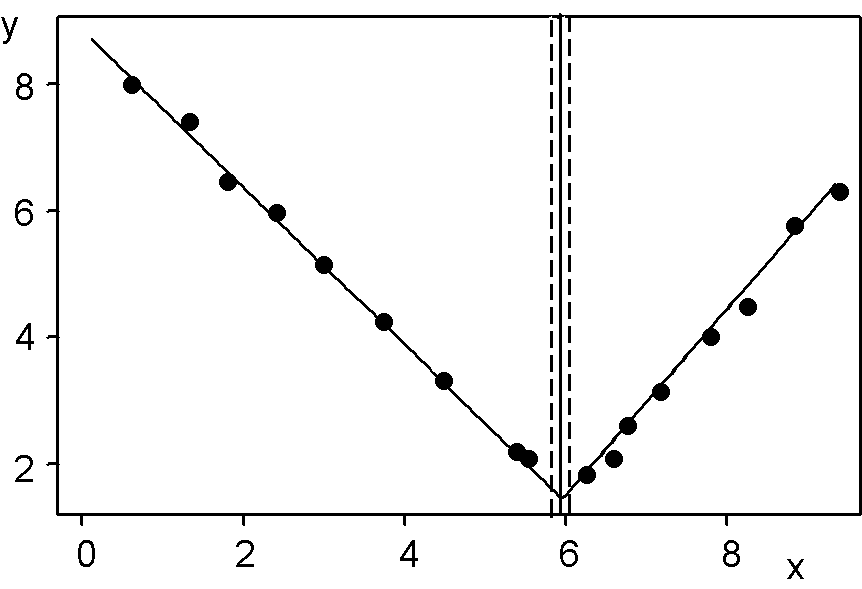
Fig. 1a Algorithmic operation: the regression model with both linear segments is found; Data: generated linear data with a true value of the end-point 5.90 ml; Estimated end-point: 5.90 ml with the 95% confidence interval LL = 5.82 ml and LU = 5.98 ml; Conclusion: accurate and precise estimation |
|
|
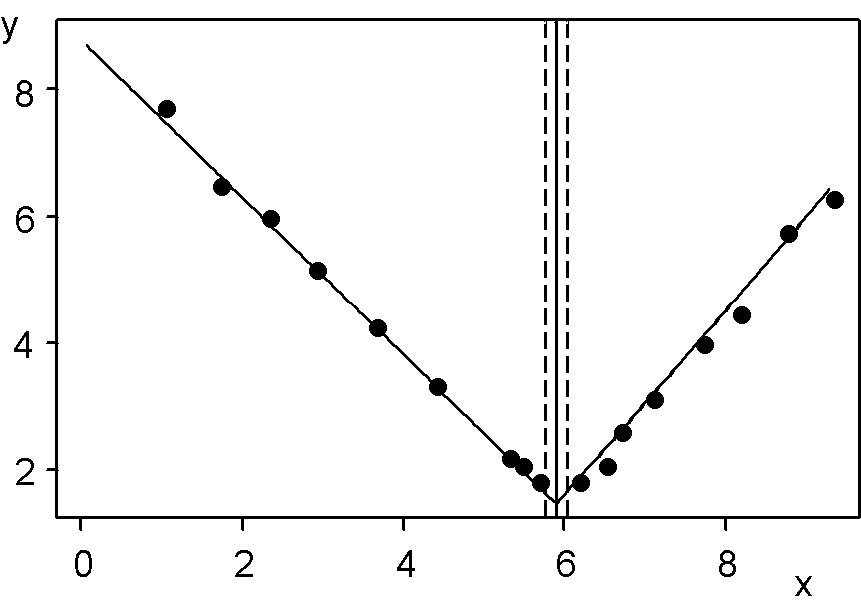
Fig. 1b Heuristic operation: the regression model with both quadratic segments is forced; Data: generated linear data with a true value of the end-point 5.90 ml; Estimated end-point: 5.90 ml with the 95% confidence interval LL = 5.76 ml and LU = 6.03 ml; Conclusion: accurate and imprecise estimation |
|
|
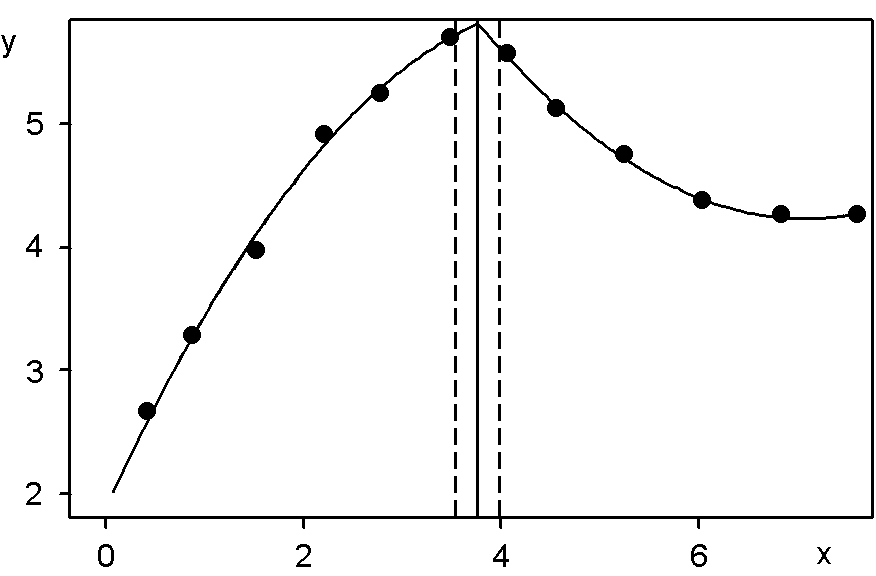
Fig. 2a Algorithmic operation: the regression model with both quadratic segments is found; Data: generated nonlinear data with a true value of the end-point 3.60 ml; Estimated end-point: 3.63 ml with the 95% confidence interval LL = 3.41 ml and LU = 3.85 ml; Conclusion: accurate and precise estimation |
|
|
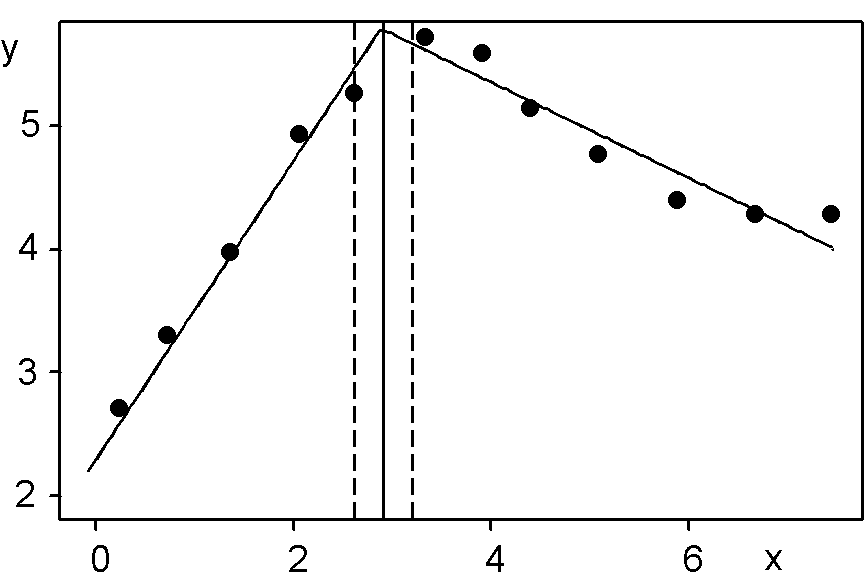
Fig. 2b Heuristic operation: the regression model with both linear segments is forced; Data: generated data with a true value of the end-point 3.60 ml; Estimated end-point: 2.90 ml with the 95% confidence interval LL = 2.60 ml and LU = 3.19 ml; Conclusion: inaccurate and imprecise estimation |
|
|
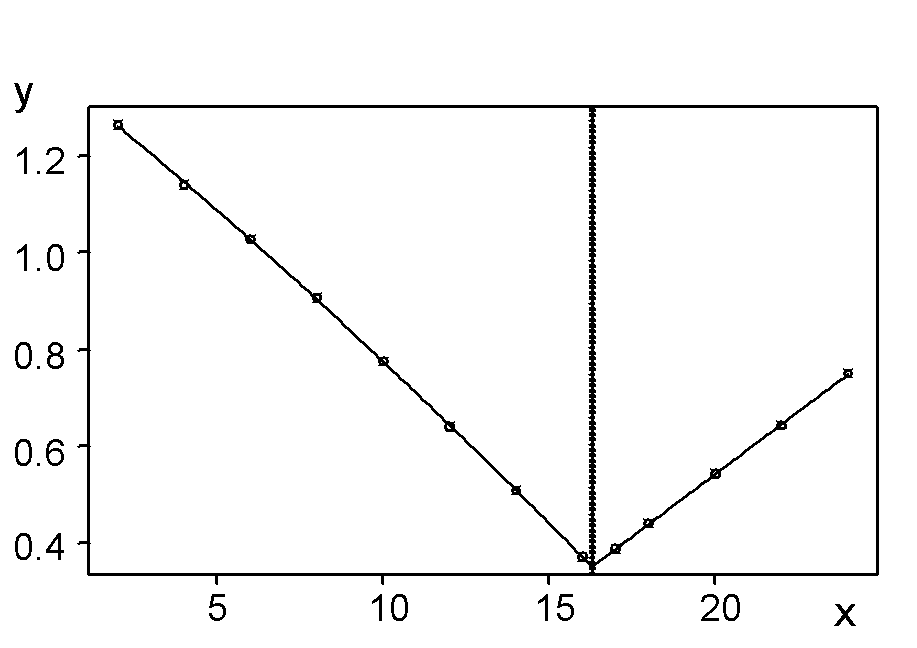
Fig. 3a Algorithmic operation: the regression model with quadratic-linear segments is found; Data: experimental data [5]; Estimated end-point: 16.28 ml with the 95% confidence interval LL = 16.22 ml and LU = 16.35 ml; Conclusion: accurate and precise estimation, the residual sum of squares for the left segment U(p) = 0.0001047 |
|
|
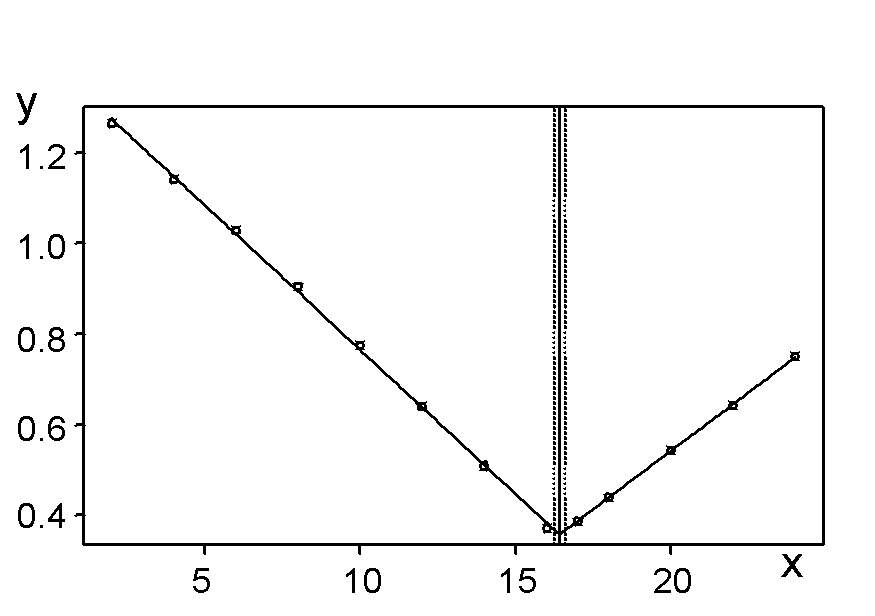
Fig. 3b Heuristic operation: the regression model with both linear segments is forced; Data: experimental data [5]; Estimated end-point: 16.41 ml with the 95% confidence interval LL = 16.24 ml and LU = 16.58 ml; Conclusion: inaccurate and inprecise estimation; the residual squares-sum for the left segment U(p) = 0.001057 |
|
|
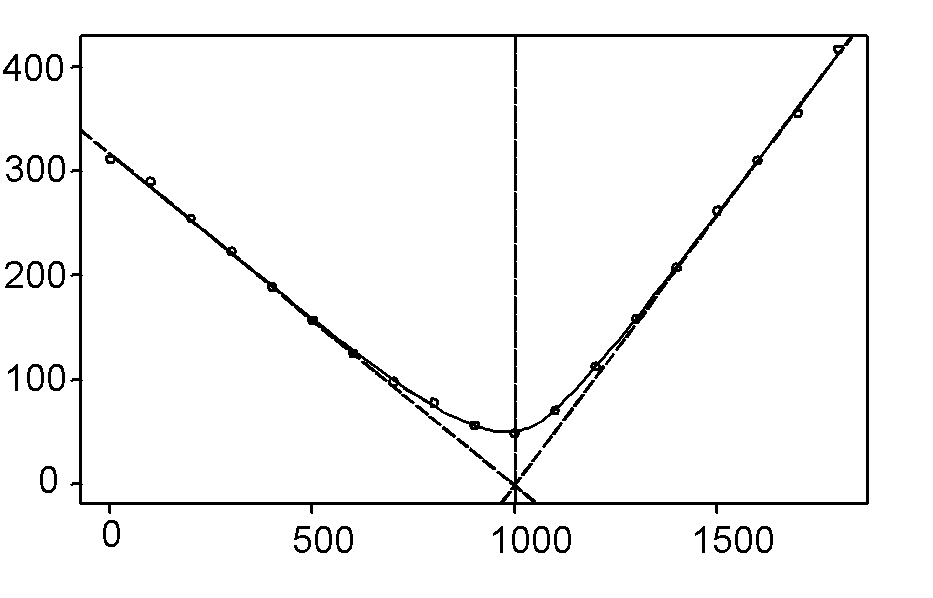
Fig. 4a Fitted titration curve (14) and (15) with analytical asymptotic lines; Data: experimental data; Estimated end-point: 977.3 μl with the 95% confidence interval LL = 966.0 μl and LU = 988.6 μl |
|
|
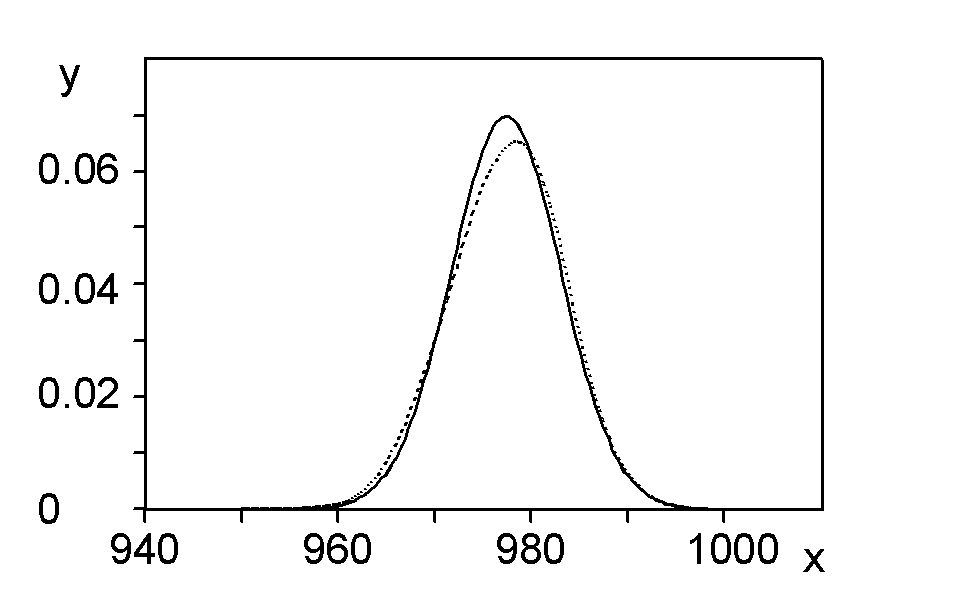
Fig. 4b Monte Carlo - generated probability density of the estimate (dashed) with the normal curve was used for estimation of end-point confidence interval using an error propagation law ; Data: experimental data |