")
")
Published in:
95. M. Meloun, J. Čapek P. Mikšík, R. G. Brereton: Critical comparison of methods predicting the number of components in spectroscopic data, Anal. Chim. Acta, 423 (2000) 51 - 68.
|
Data95.xls |
Figures |
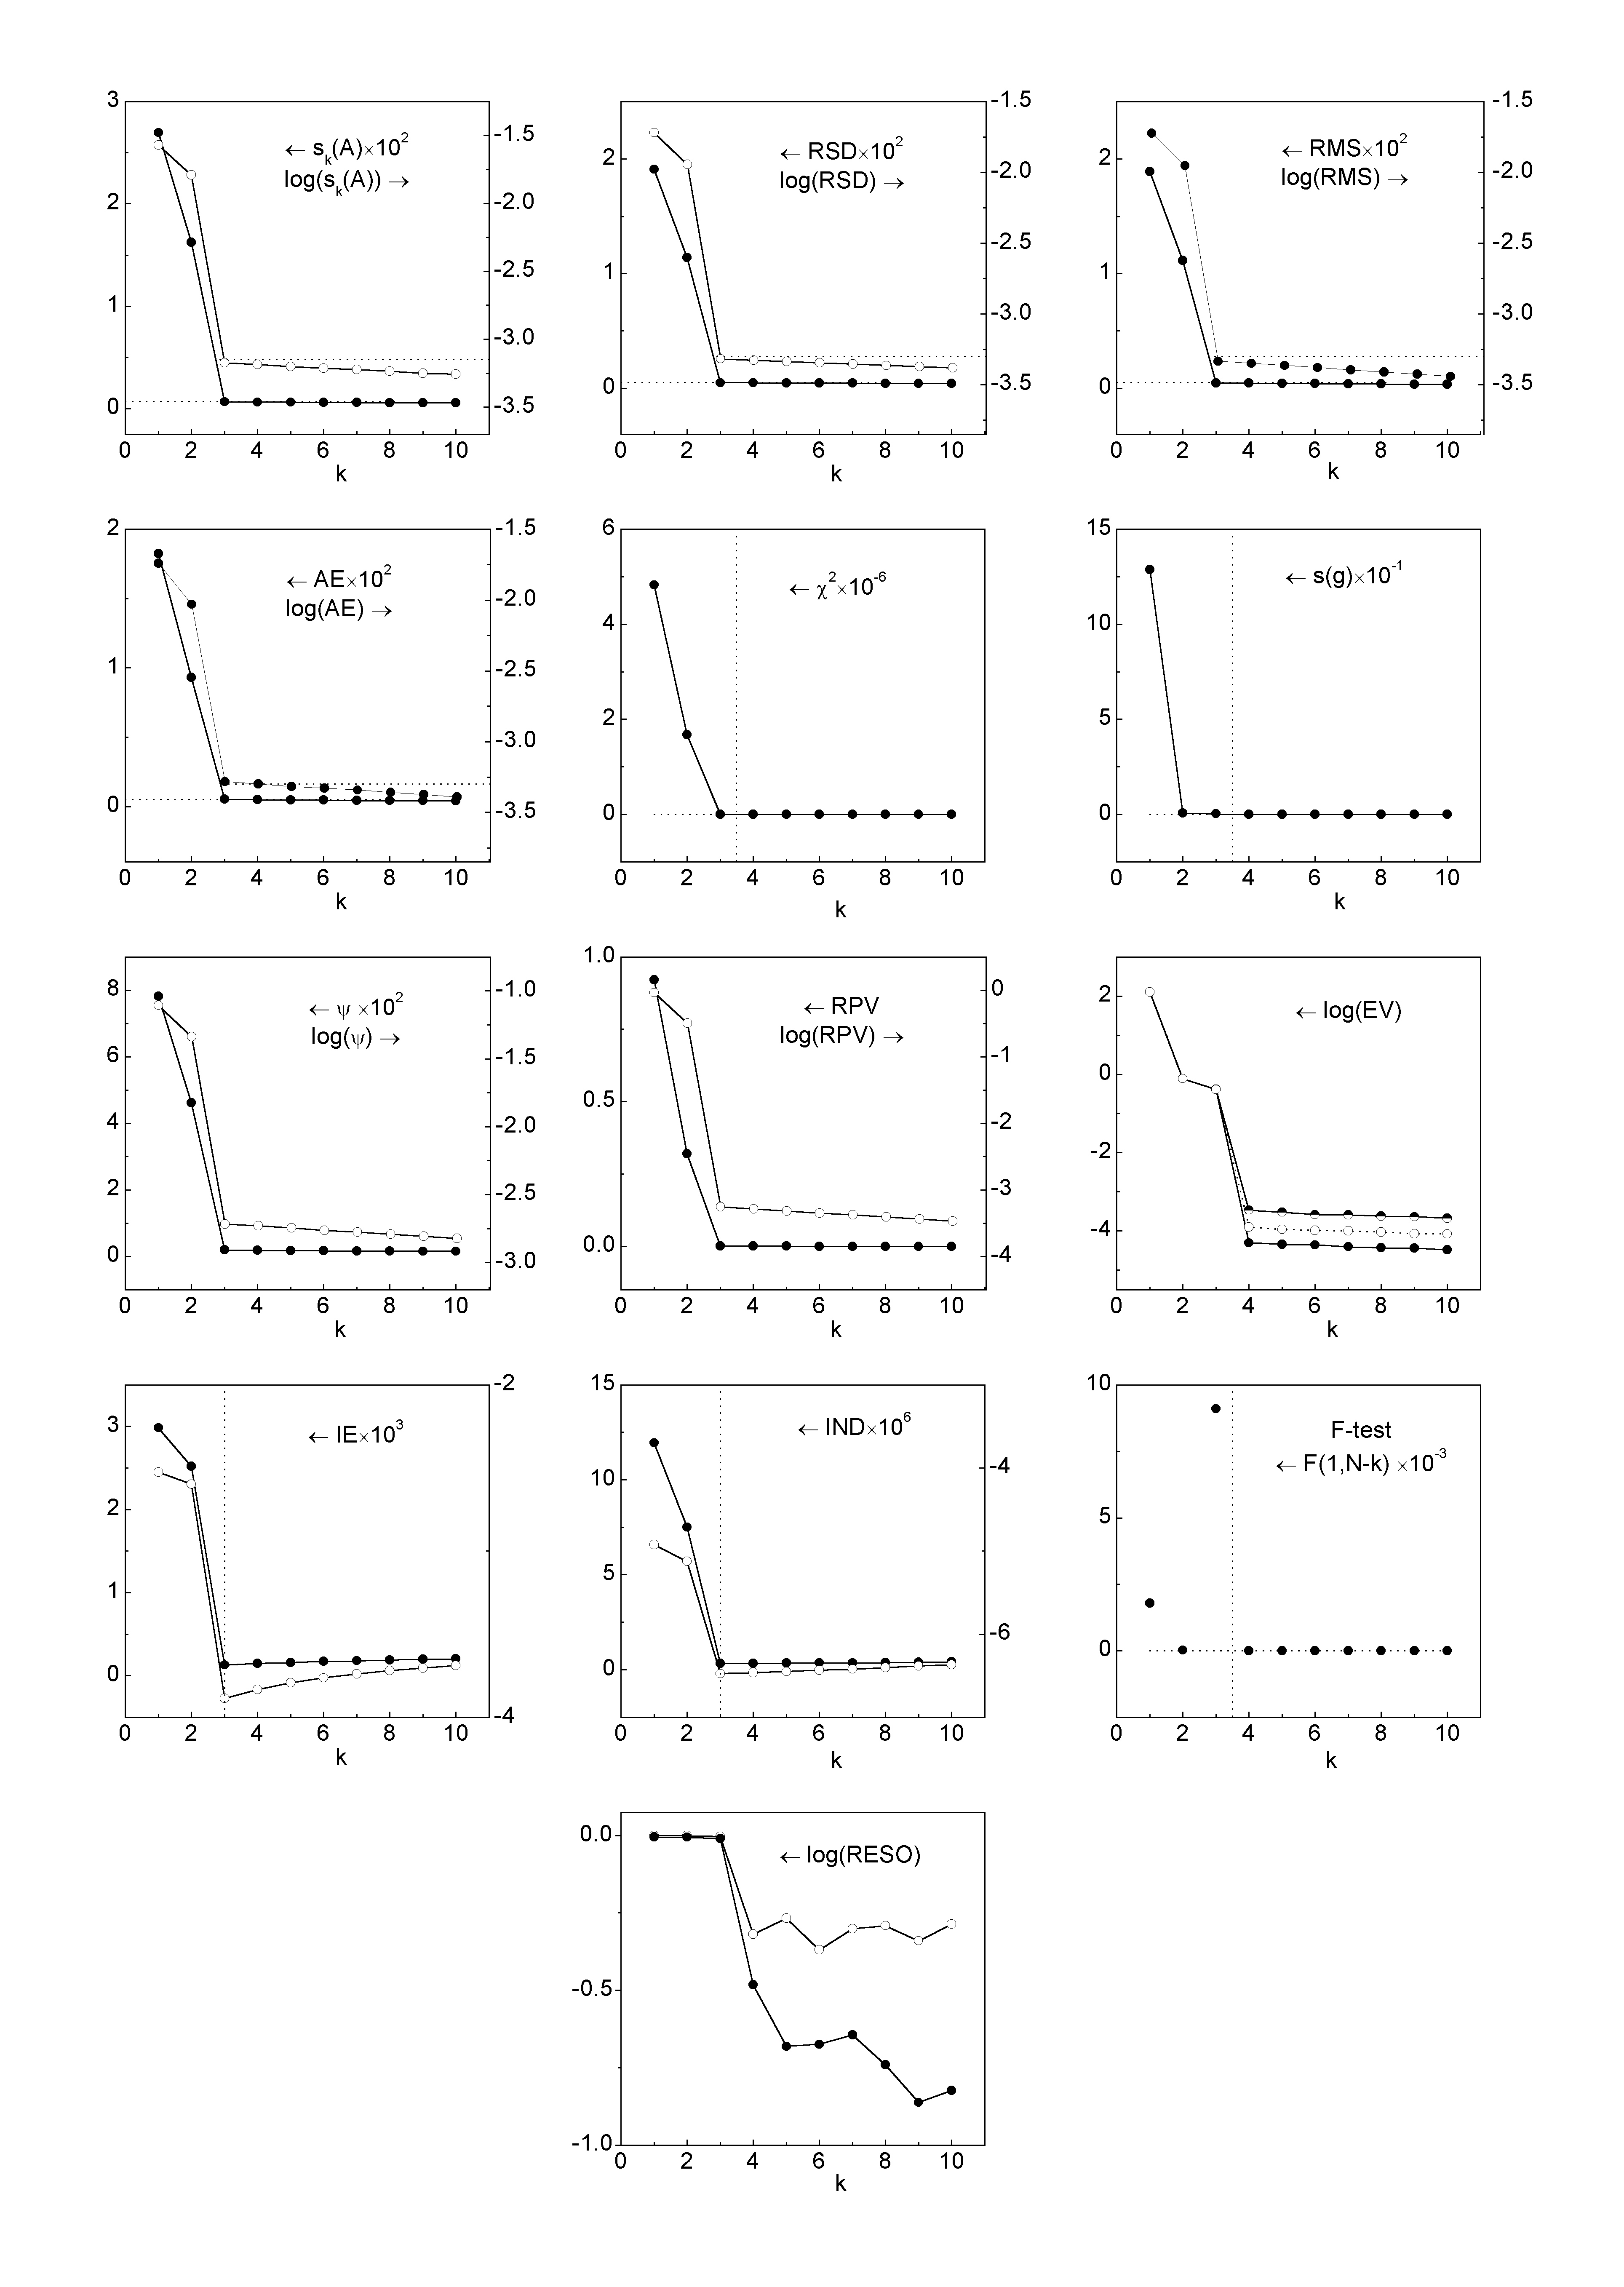
| Fig. 1 The indices (full circles) and logarithm of the indices (empty circles) of 13 methods as a function of the number of principal components k for a simulated three-components system in mixture, potassium bichromate - cobalt(II) sulphate - copper(II) sulphate, with r = 3, n = 82, m = 41 and SER = 1570, S-Plus. | |
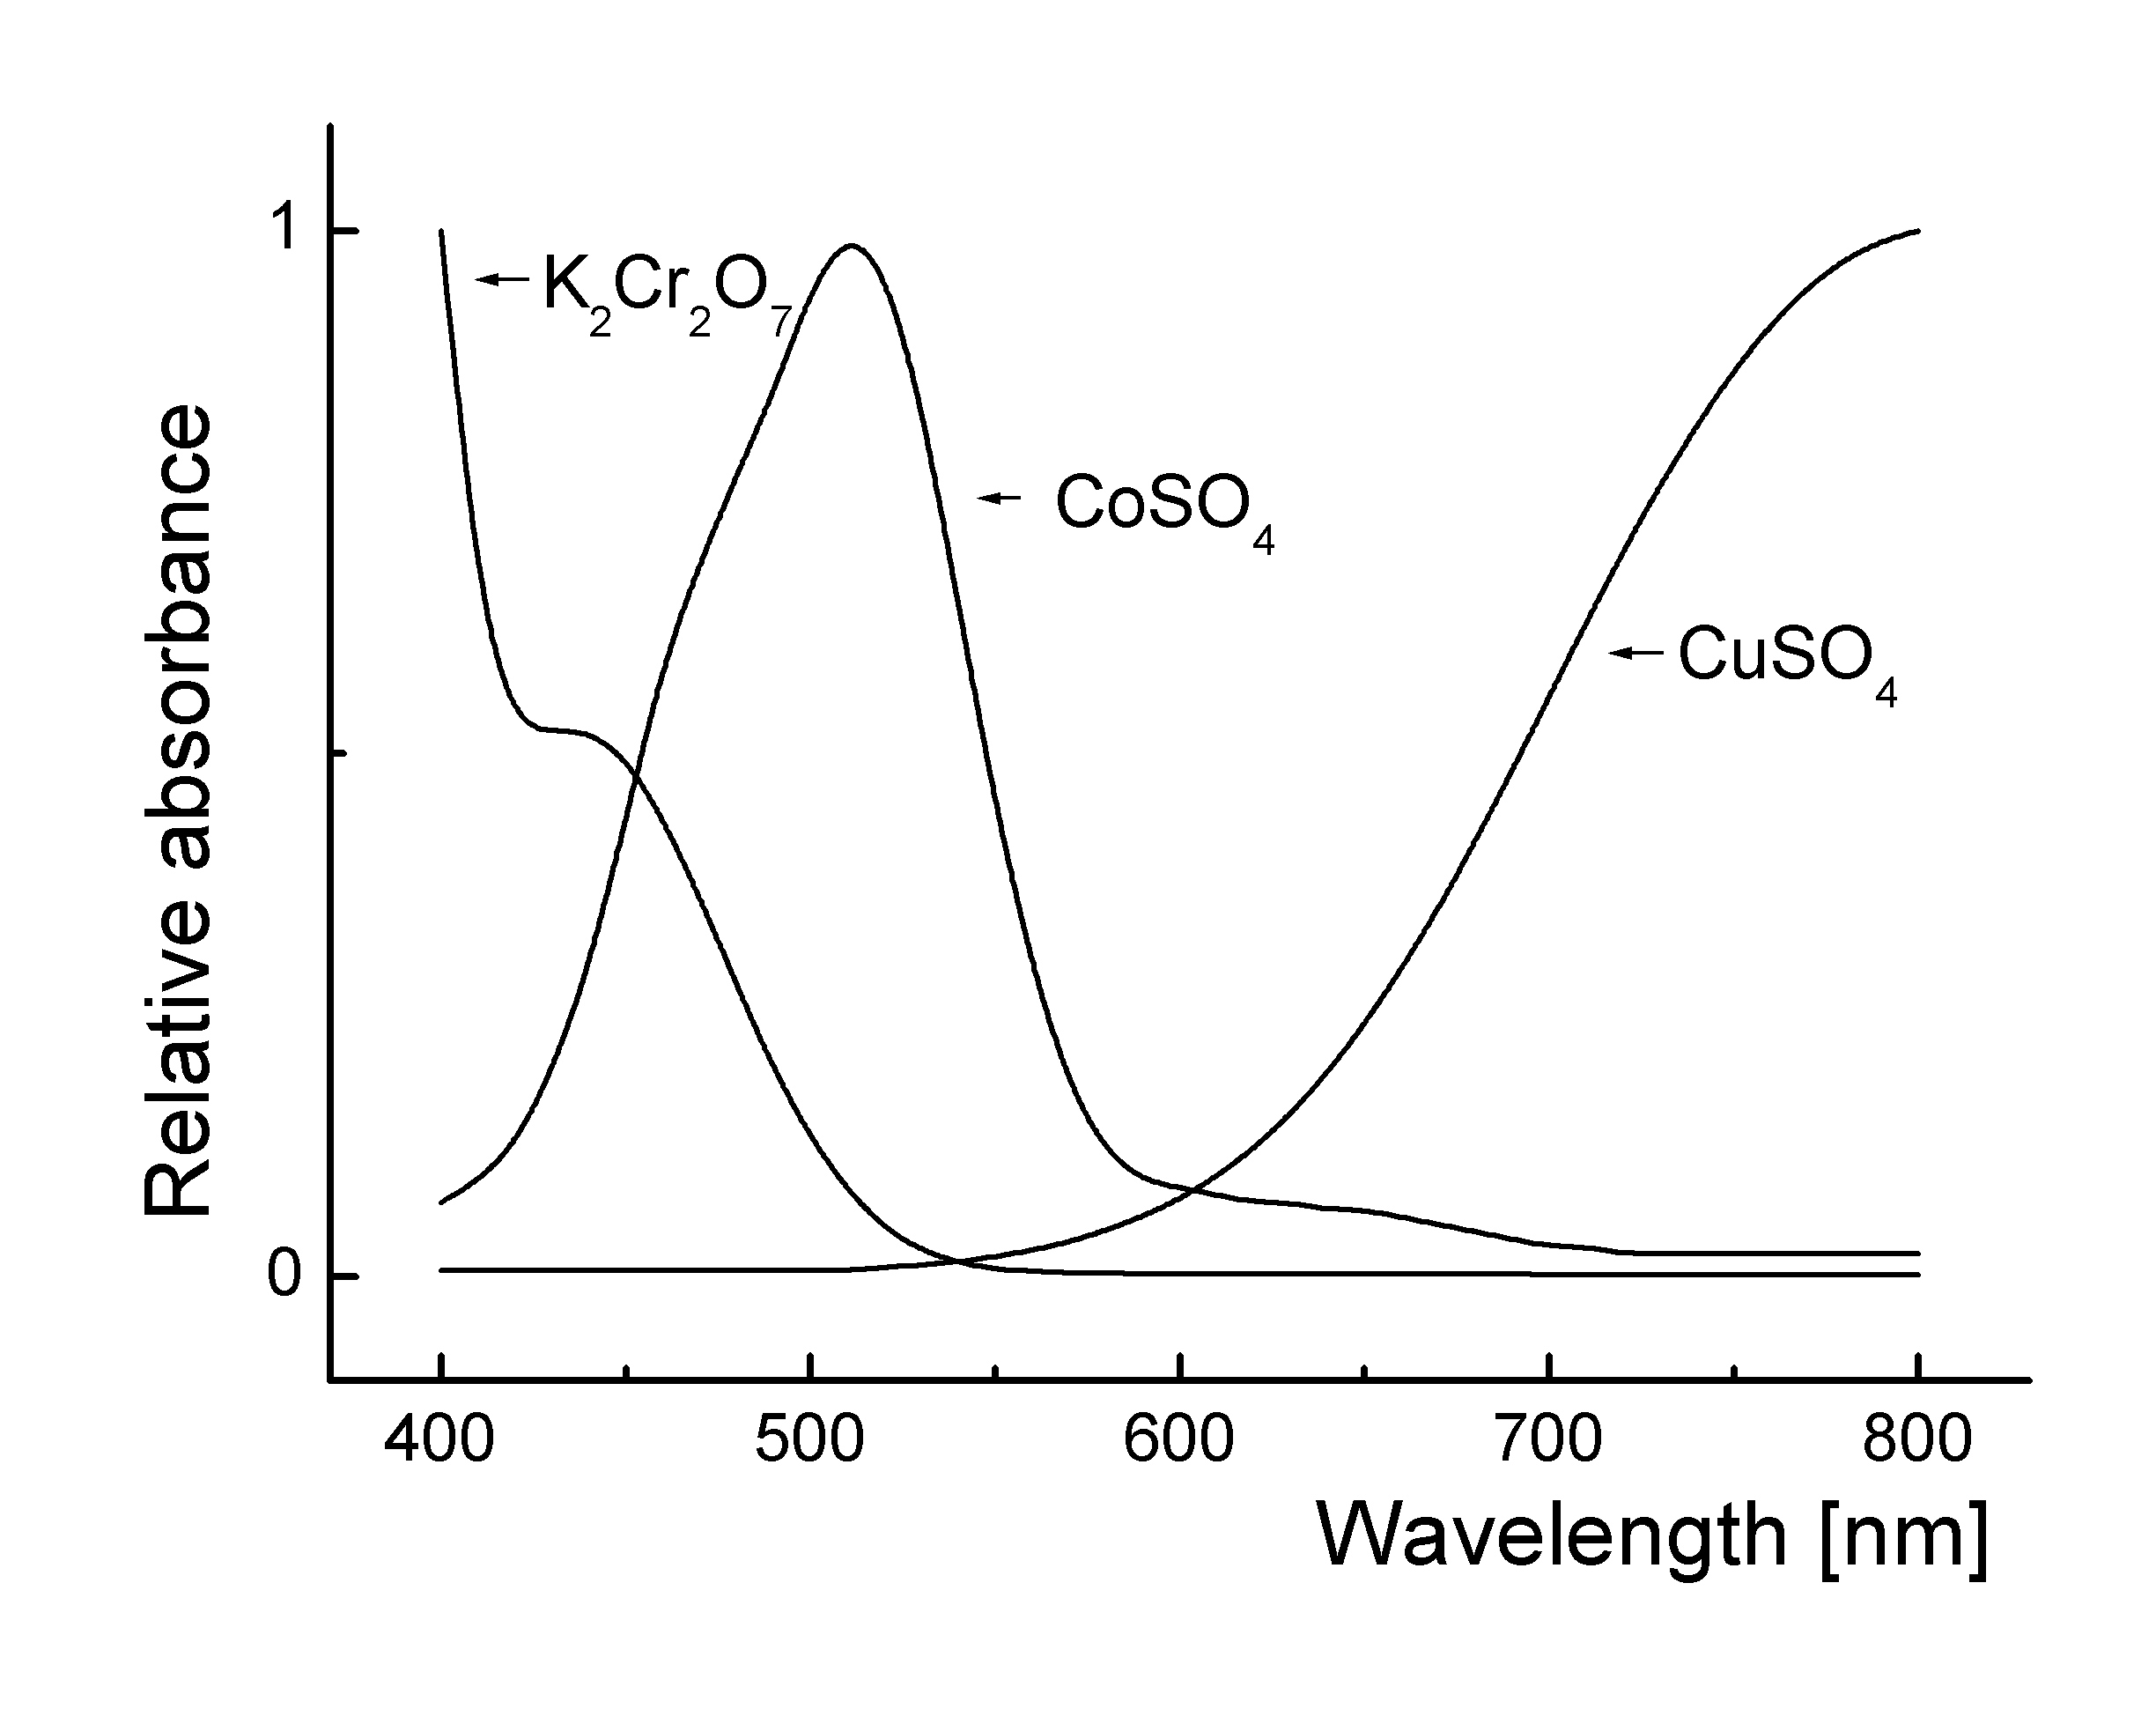
| Fig. 2a Spectra of relative absorbance for three components described on Fig. 1. | |
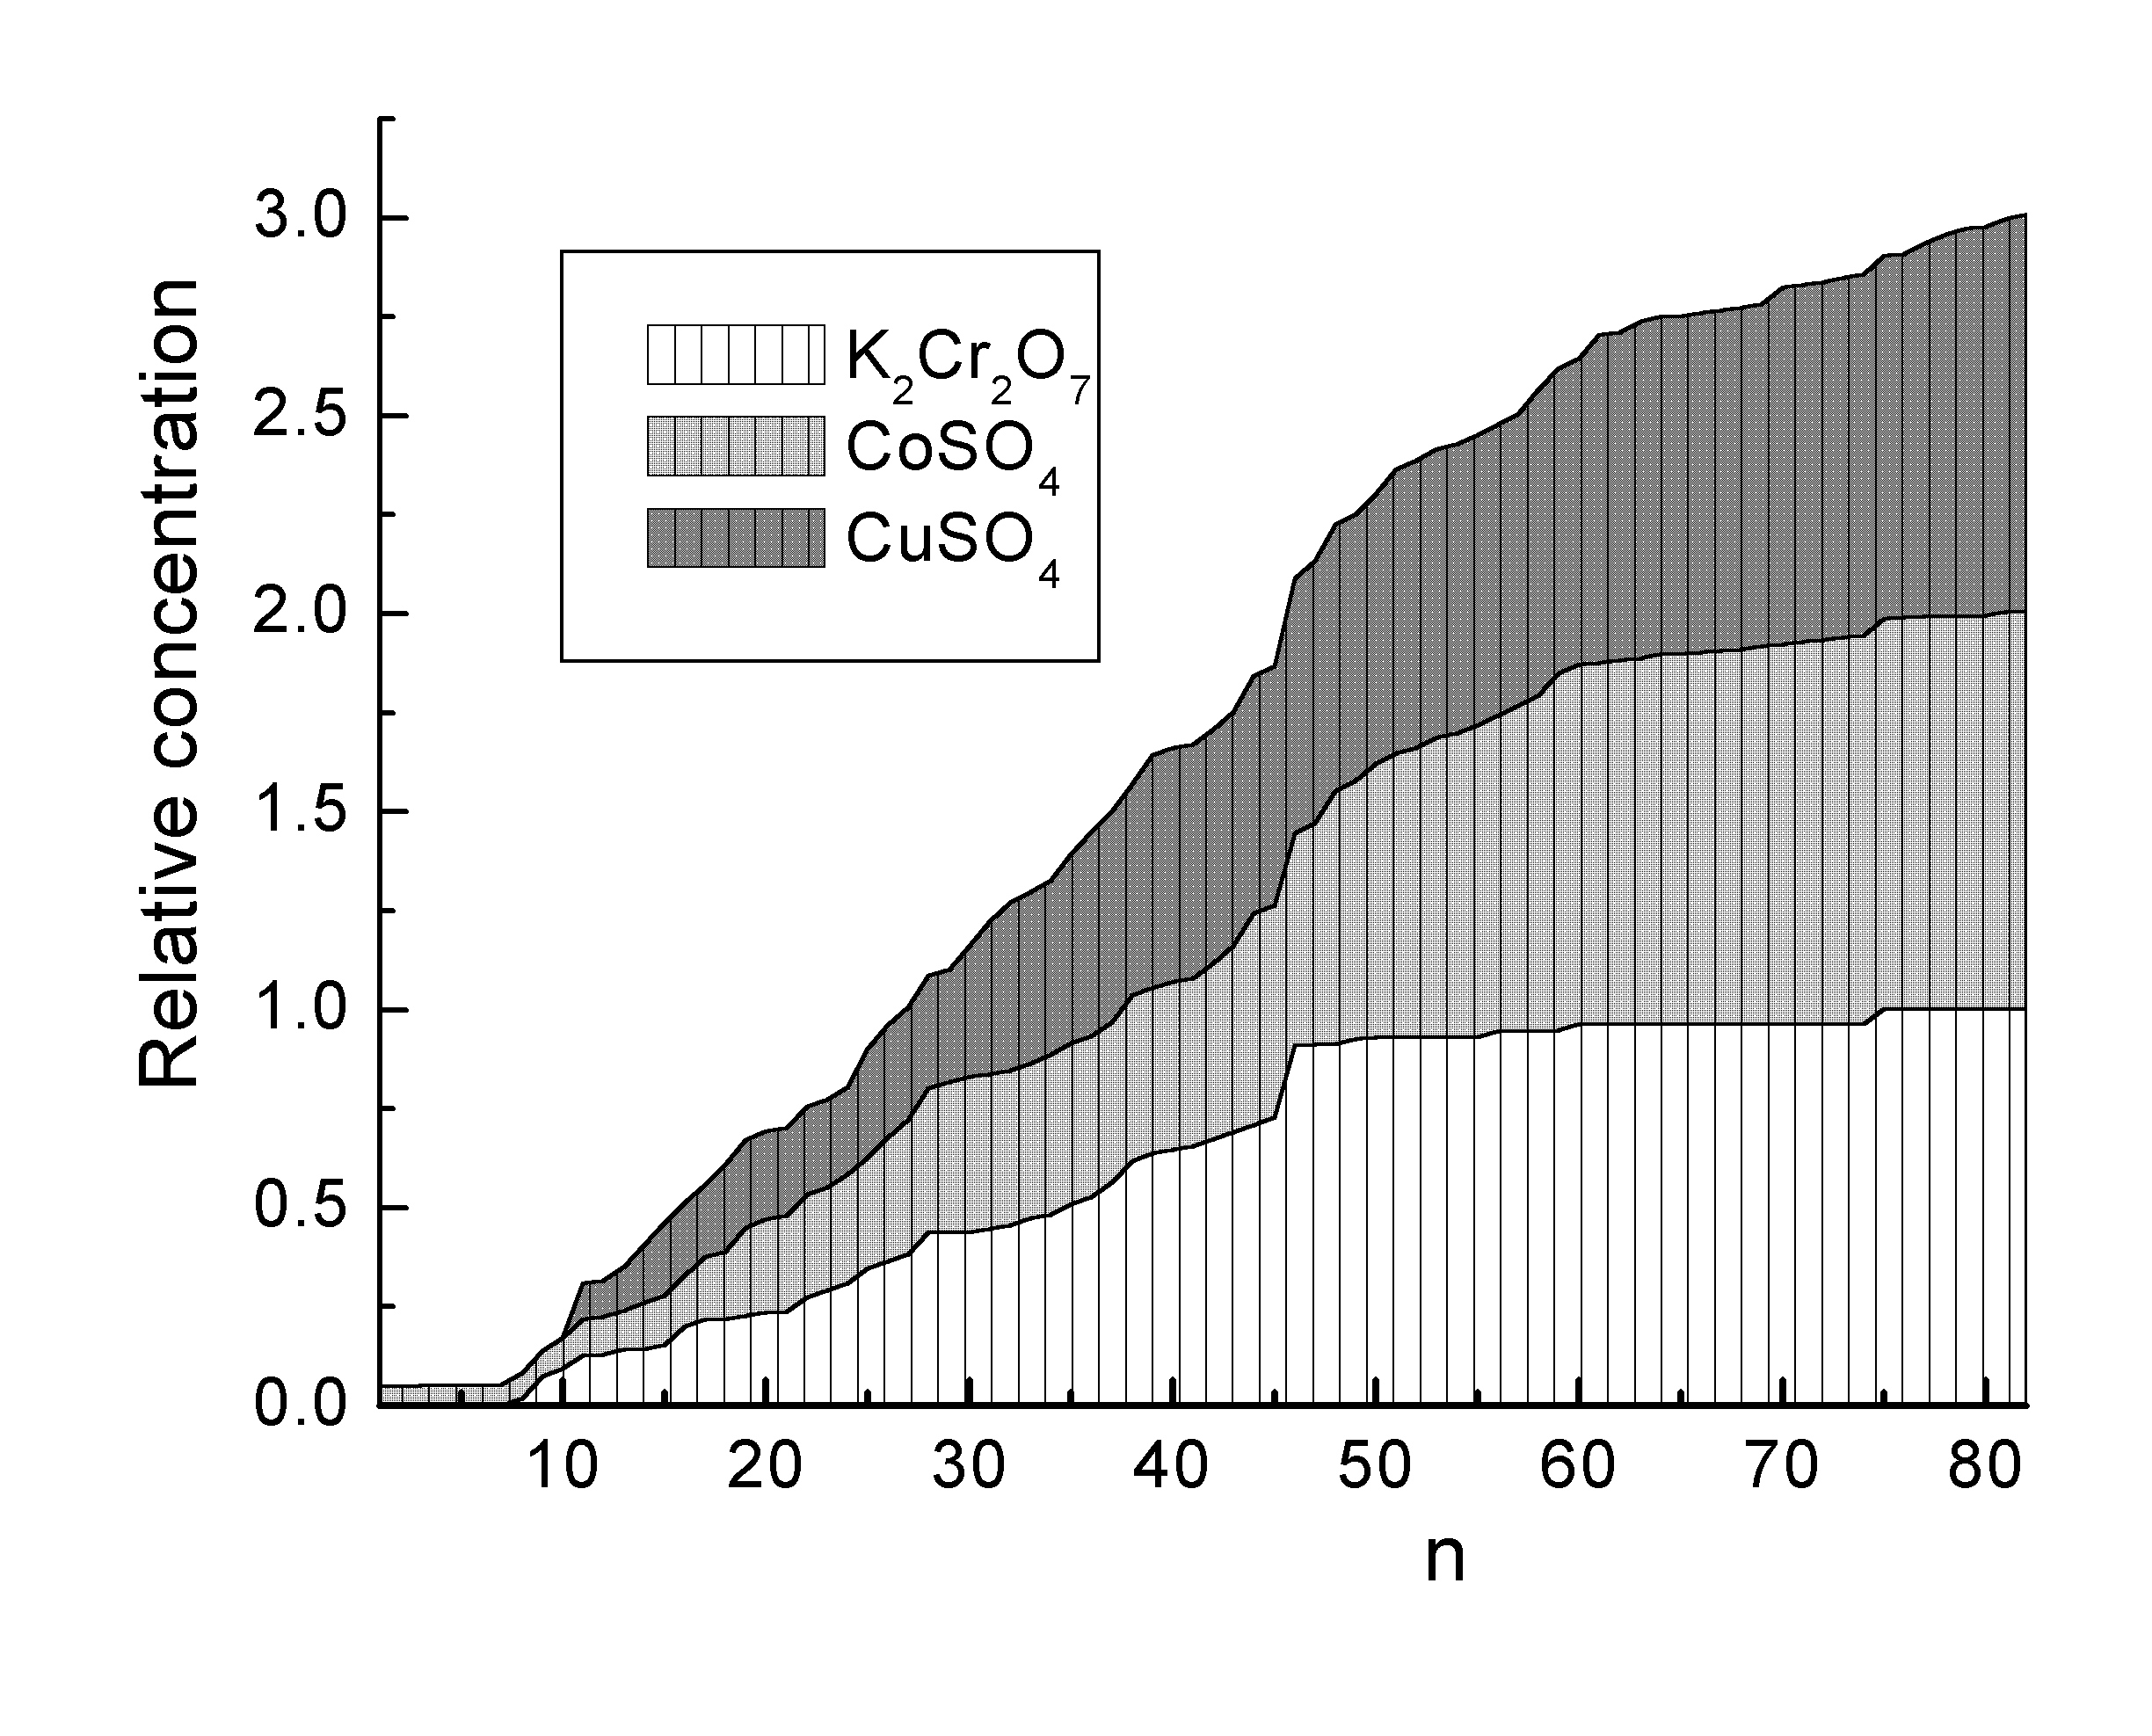
| Fig. 2b Diagram of a relative concentration of three components in mixture for a simulated data set of three components described on Fig. 1. | |
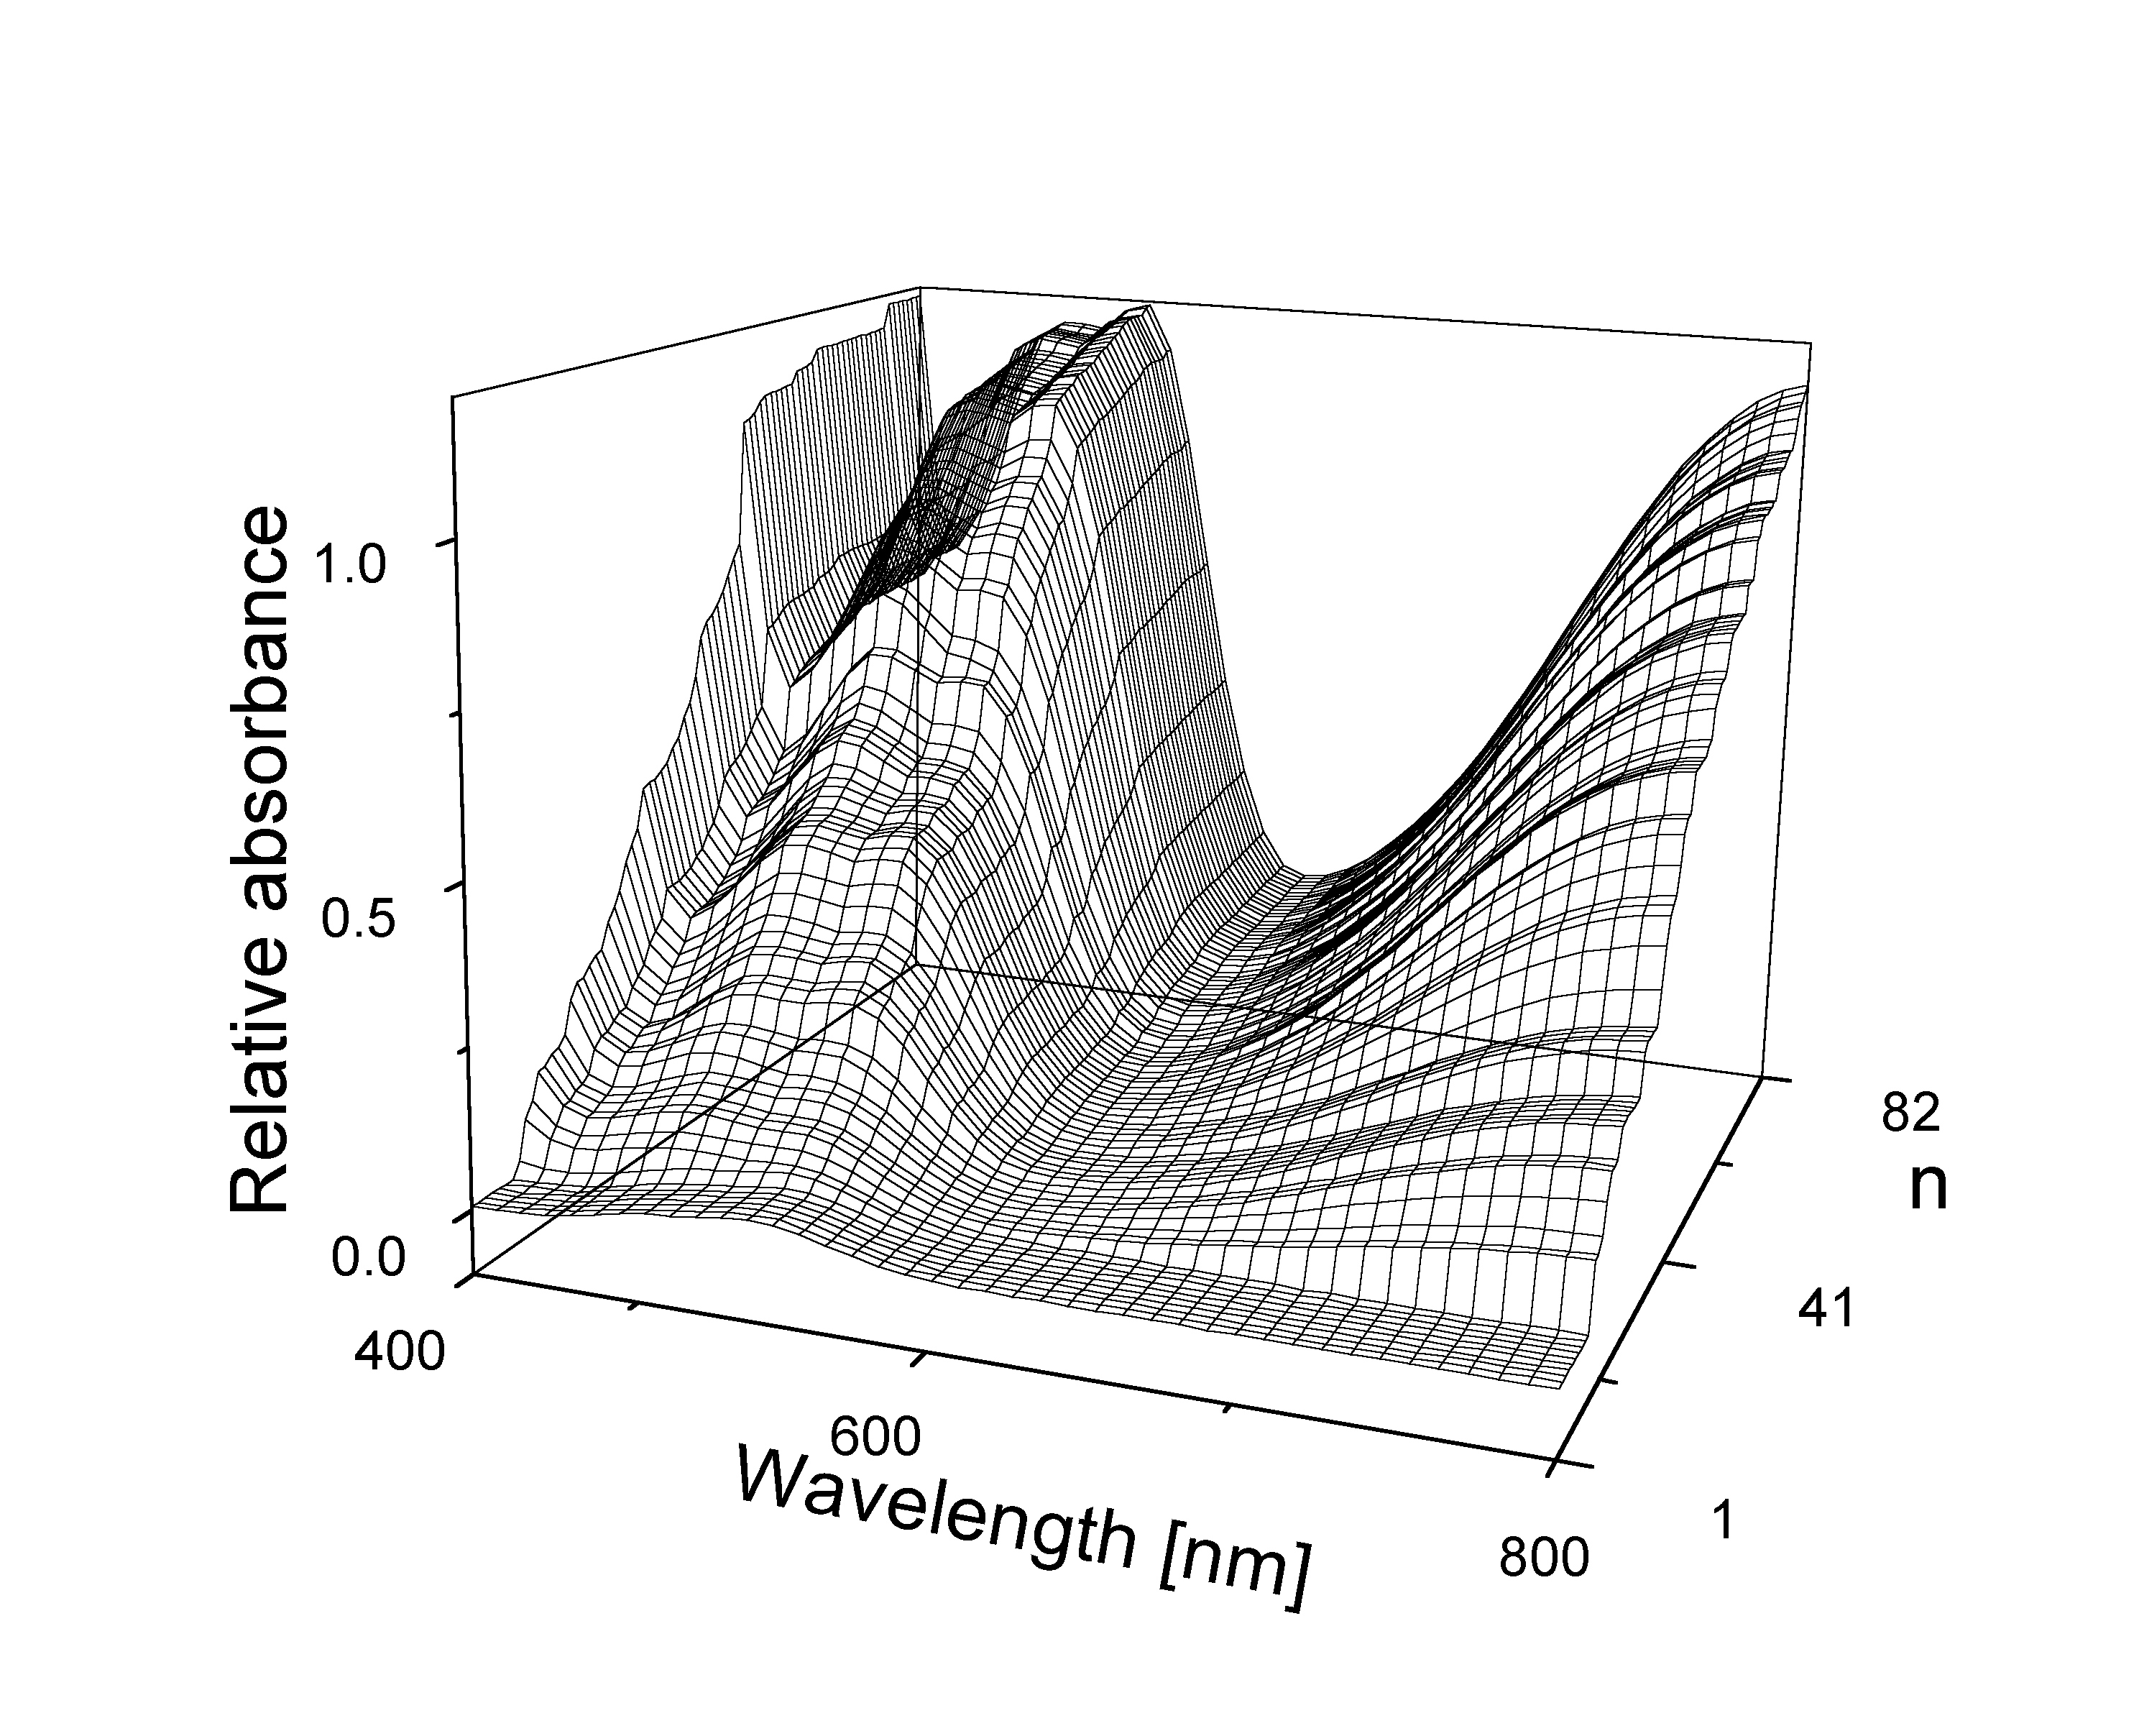
| Fig. 2c 3D-relative absorption spectra for a simulated data set of three components described on Fig. 1. | |
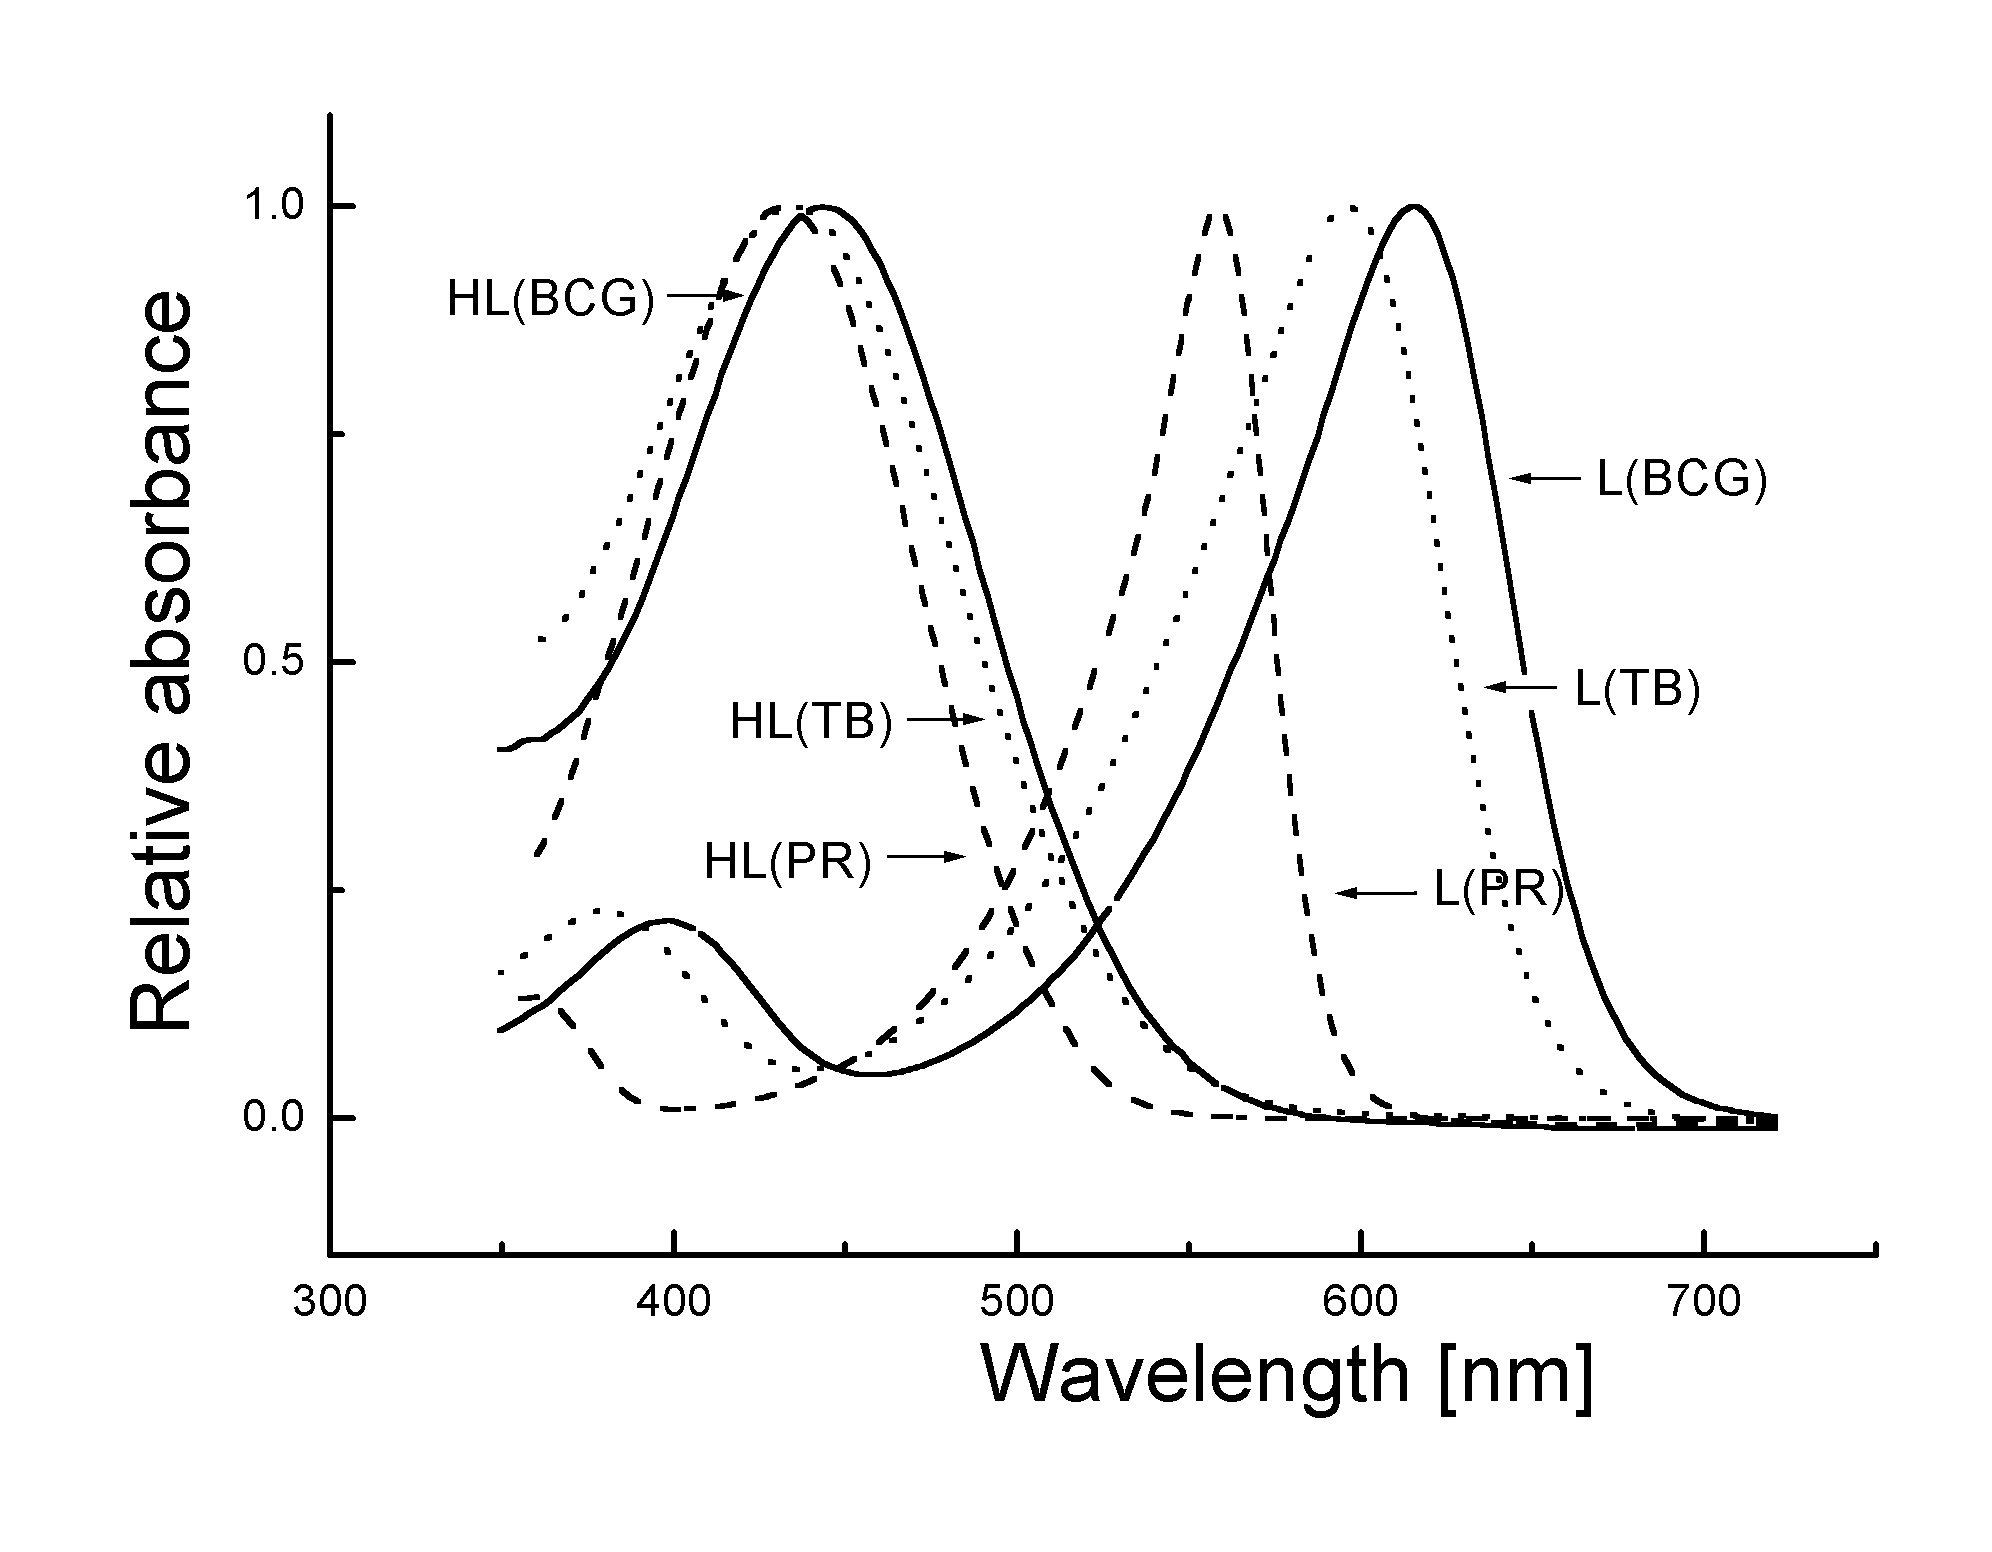
| Fig. 3Spectra of relative absorbance for 6 components i. e. the protonated form HL and anion L- of Bromocresol Green + Phenol Red + Thymol Blue in mixture with r = 6, n = 33, m = 31 and SER about 2780, S-Plus. | |
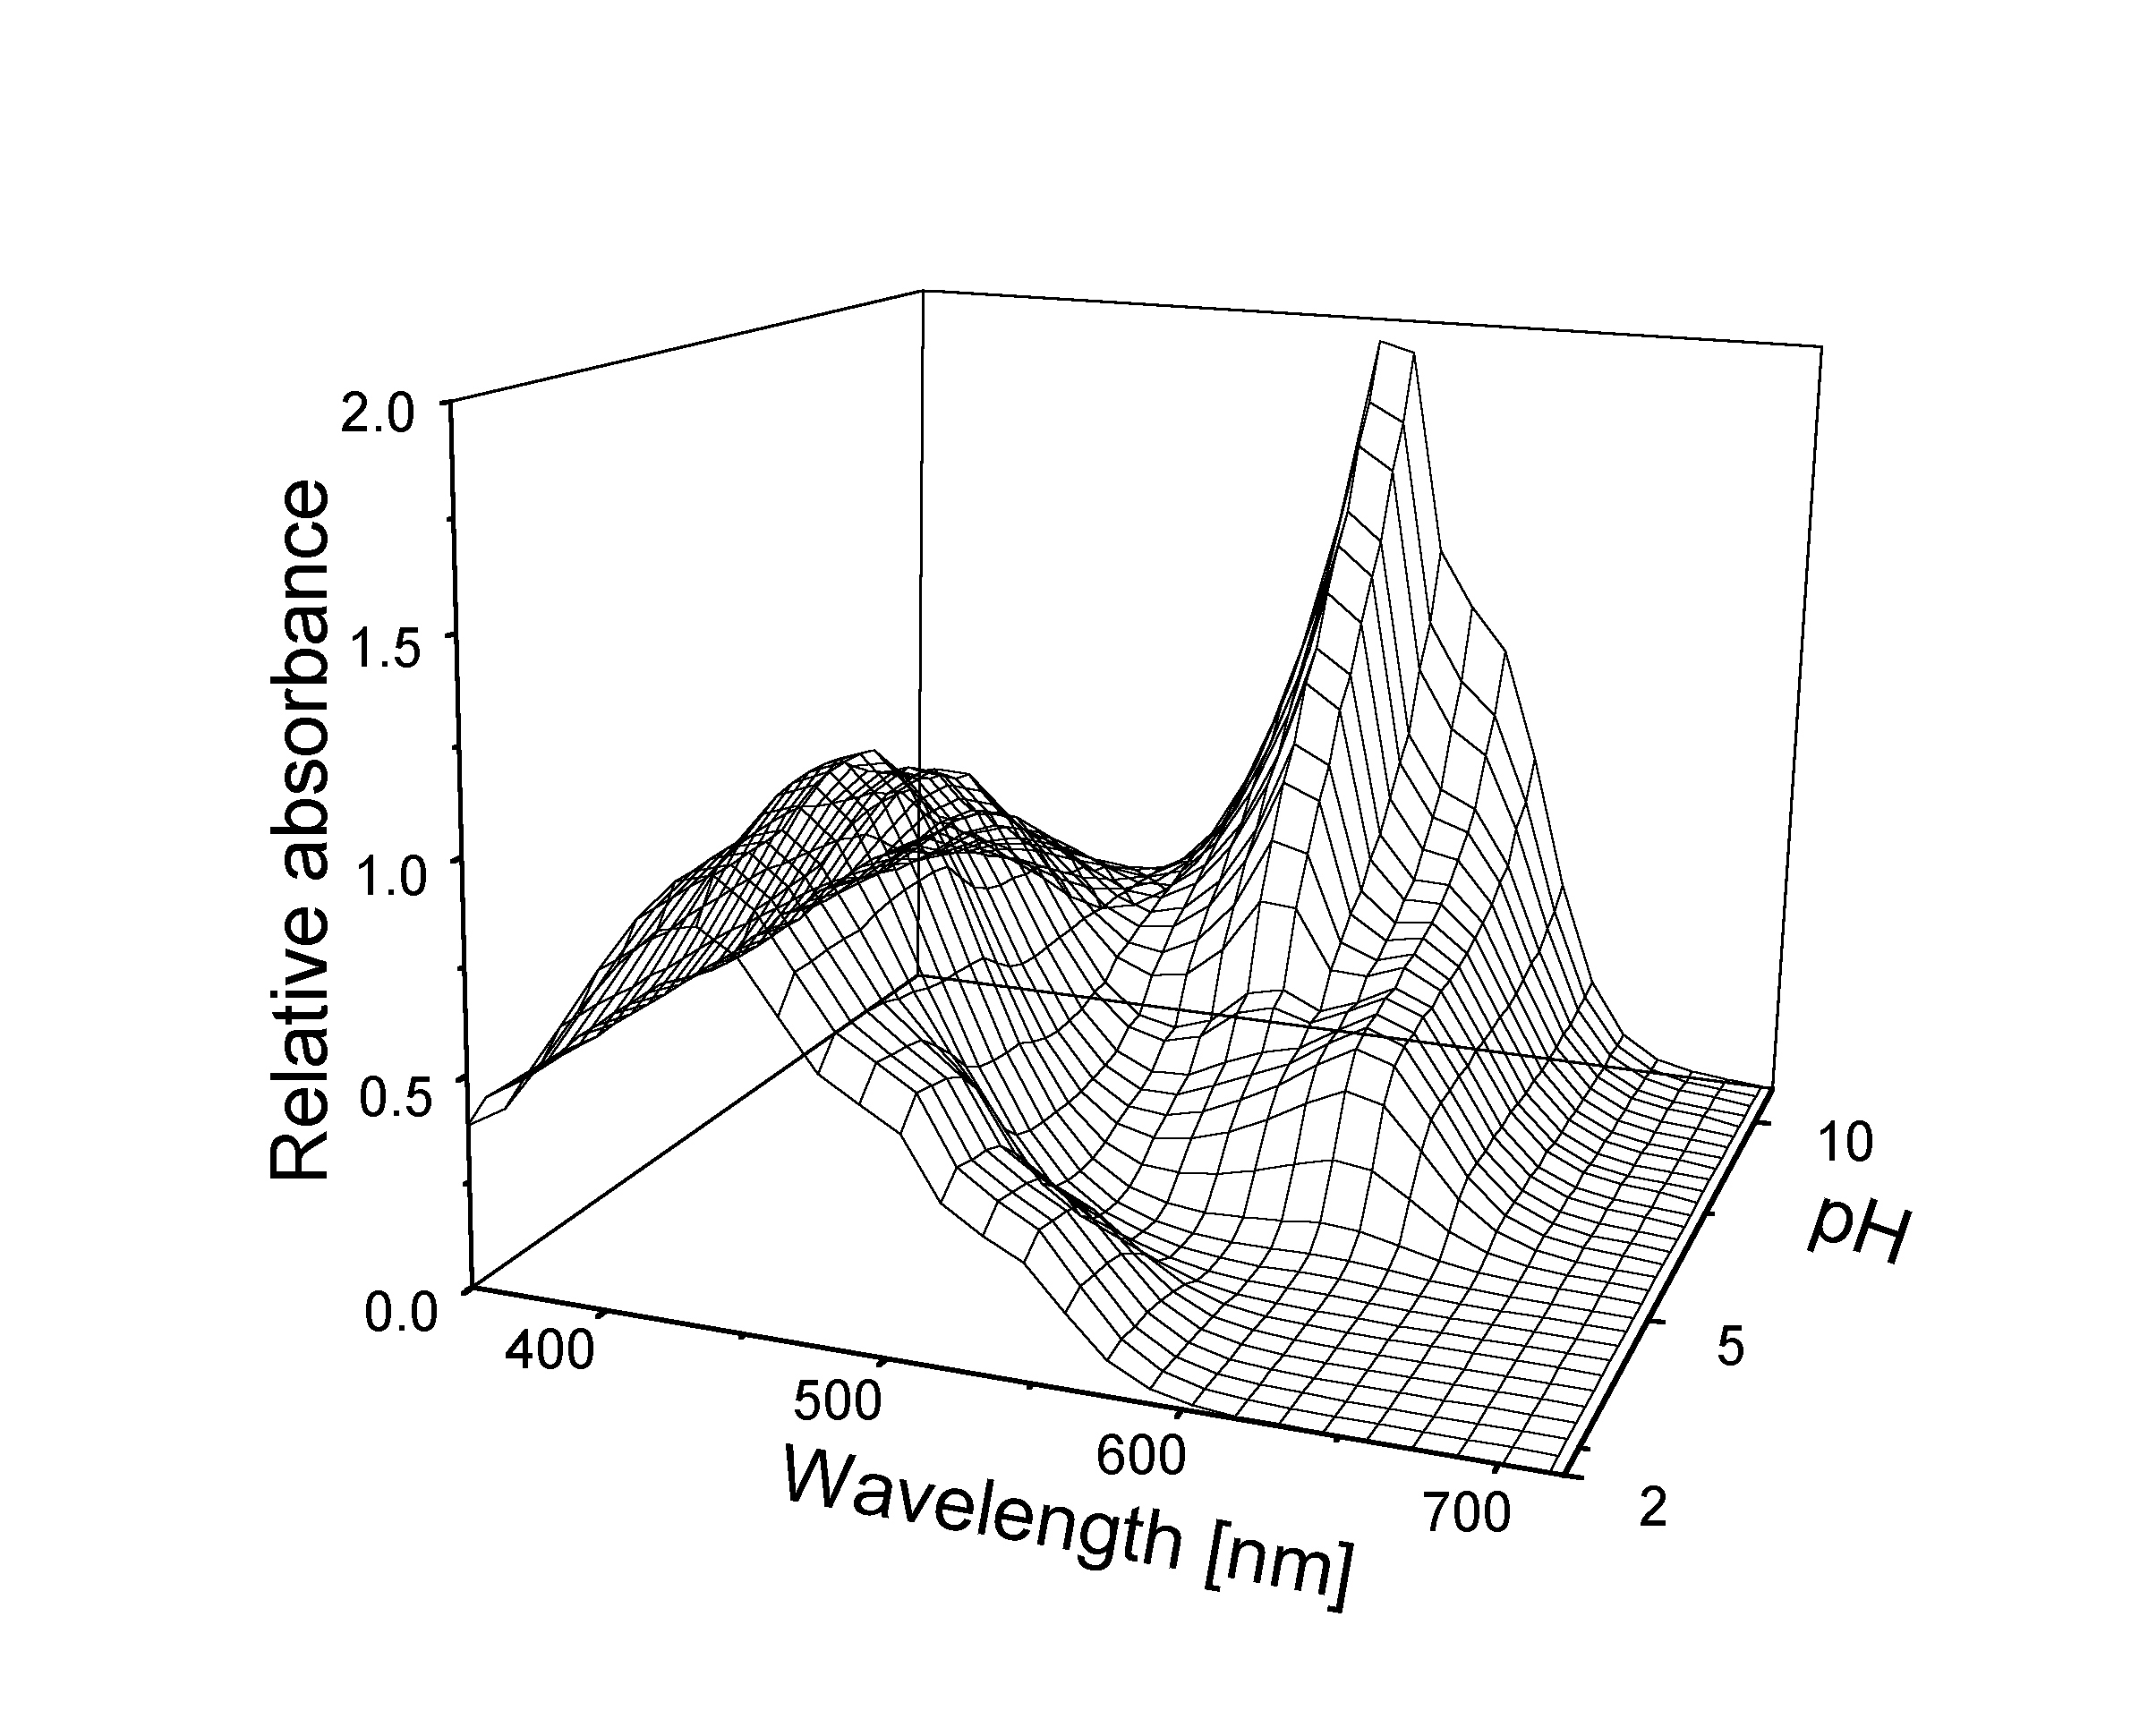
| Fig. 4 3D-relative absorption spectra for 6 components descibed on Fig. 3. | |
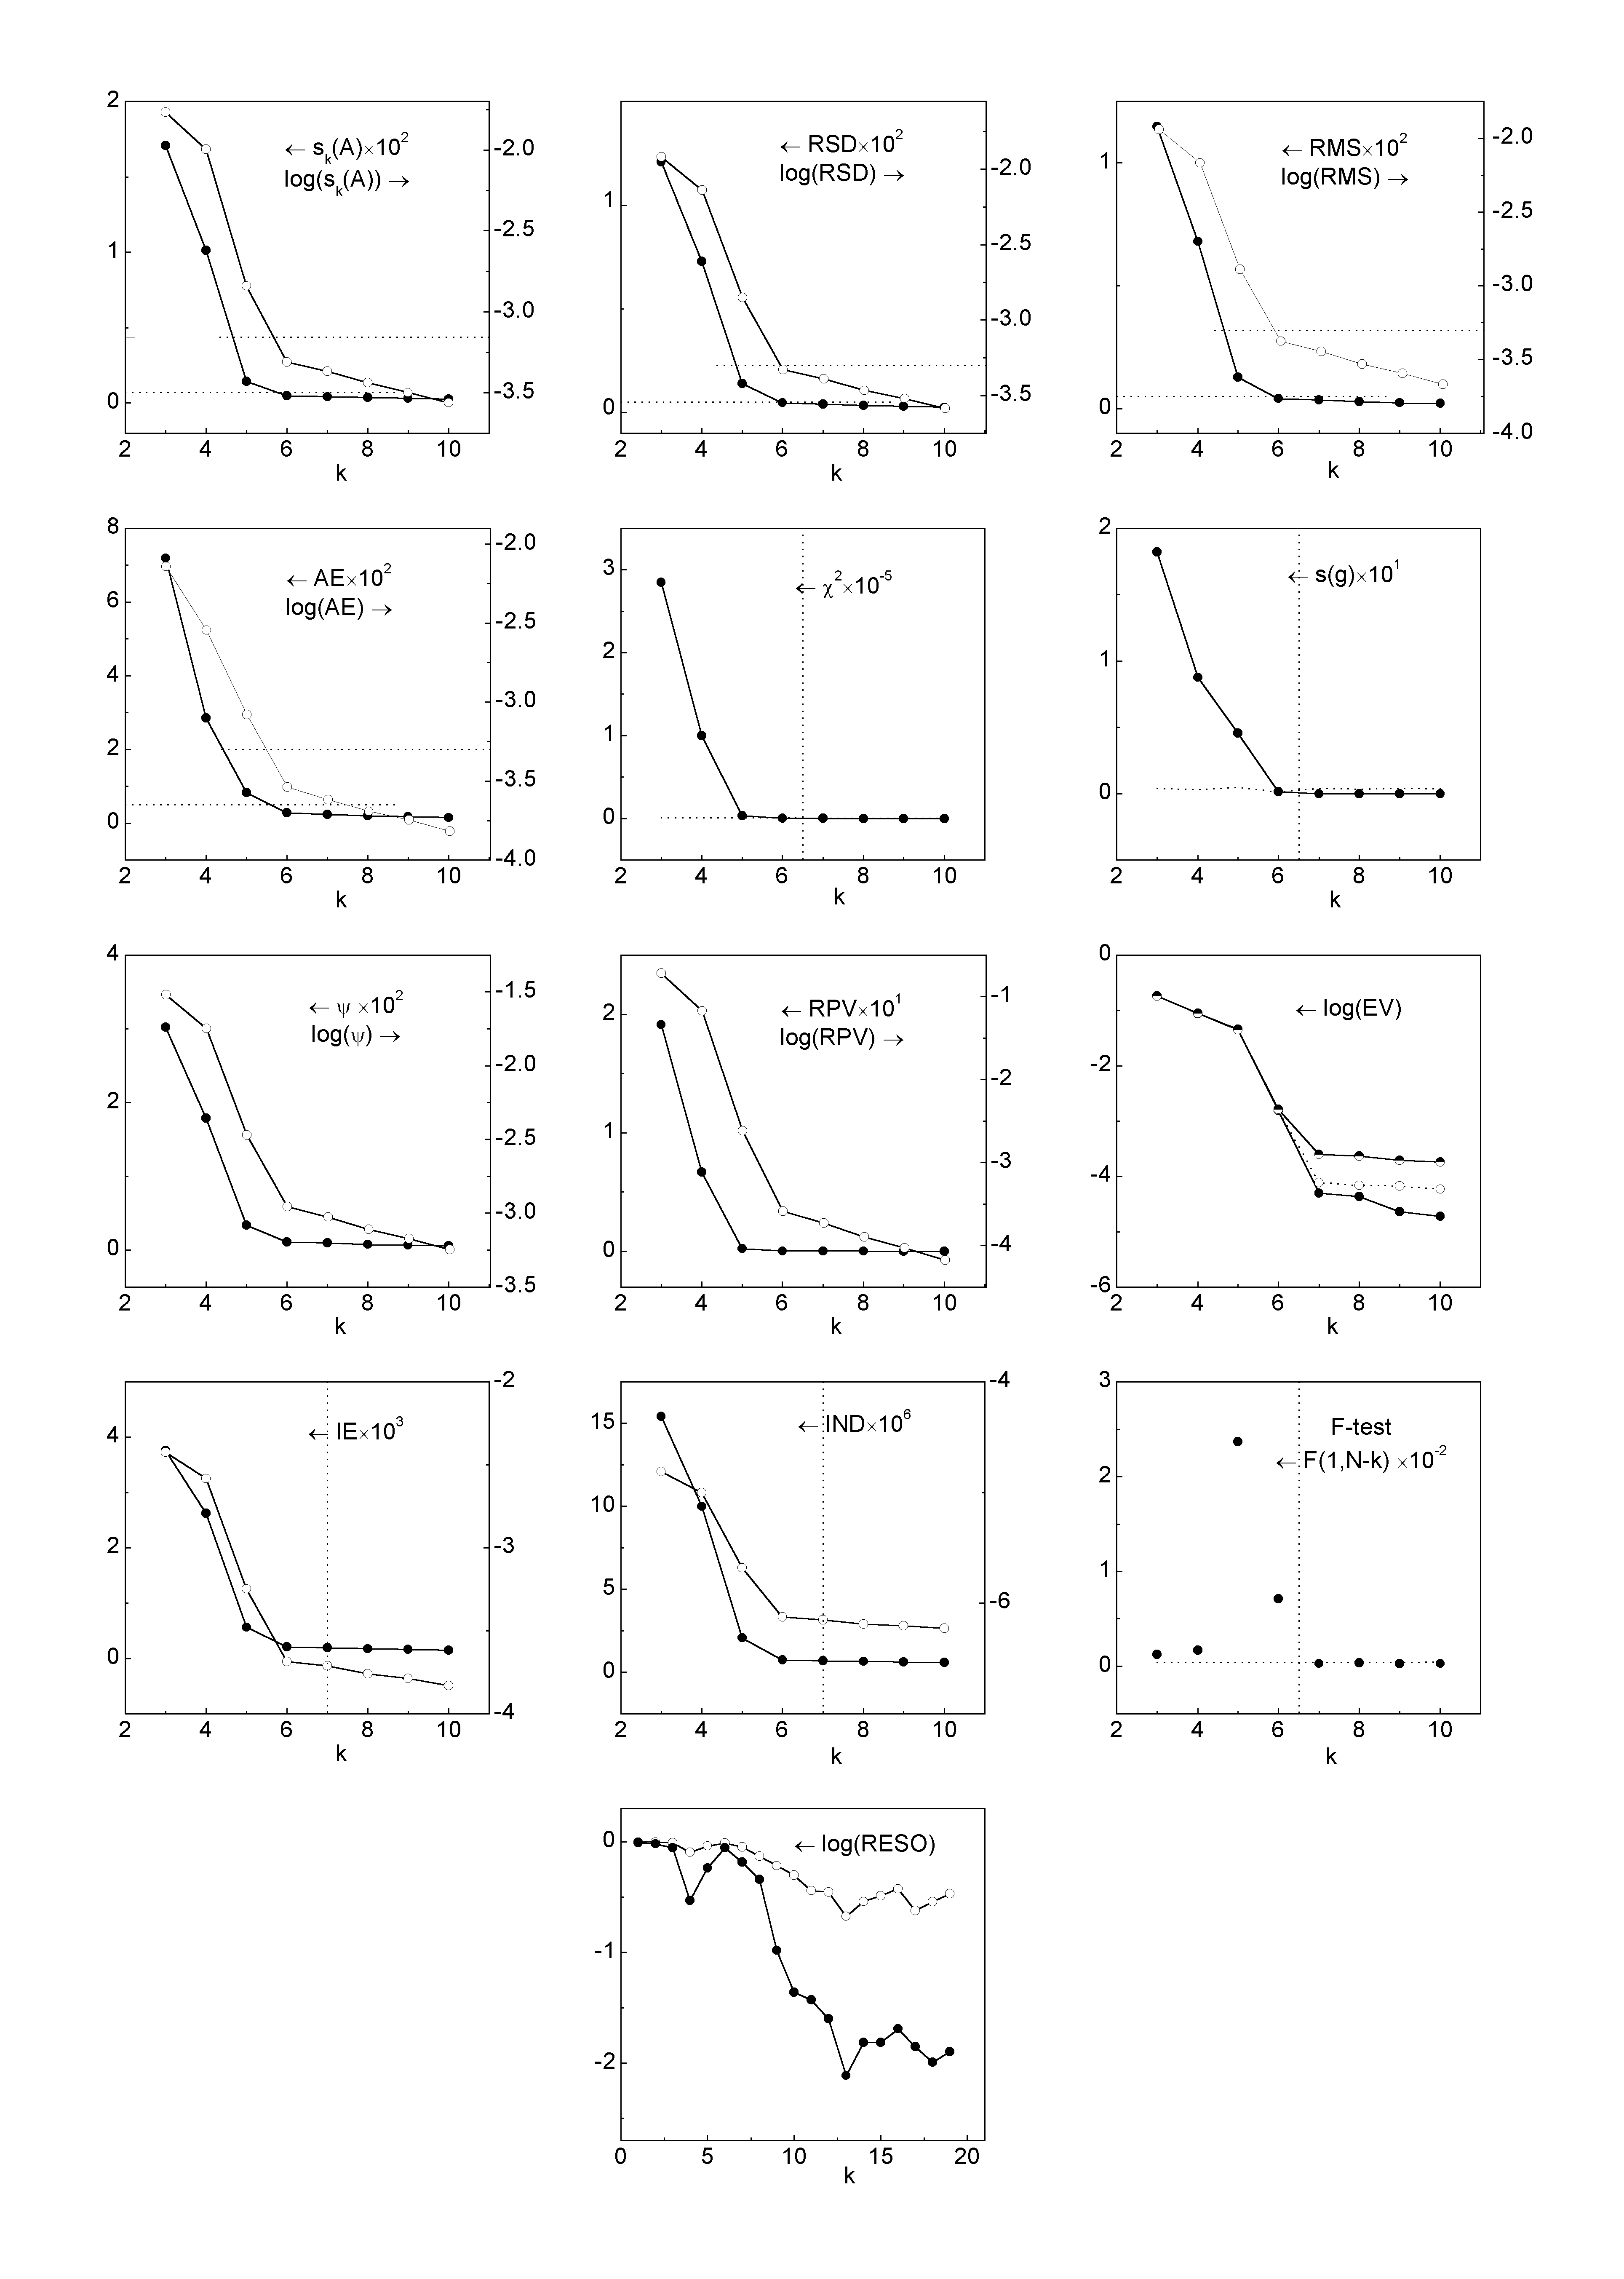
| Fig. 5 The indices (full circles) and logarithm of the indices (empty circles) of 13 methods as a function of the number of principal components k for a experimental data set of 6 components descibed on Fig. 3. | |
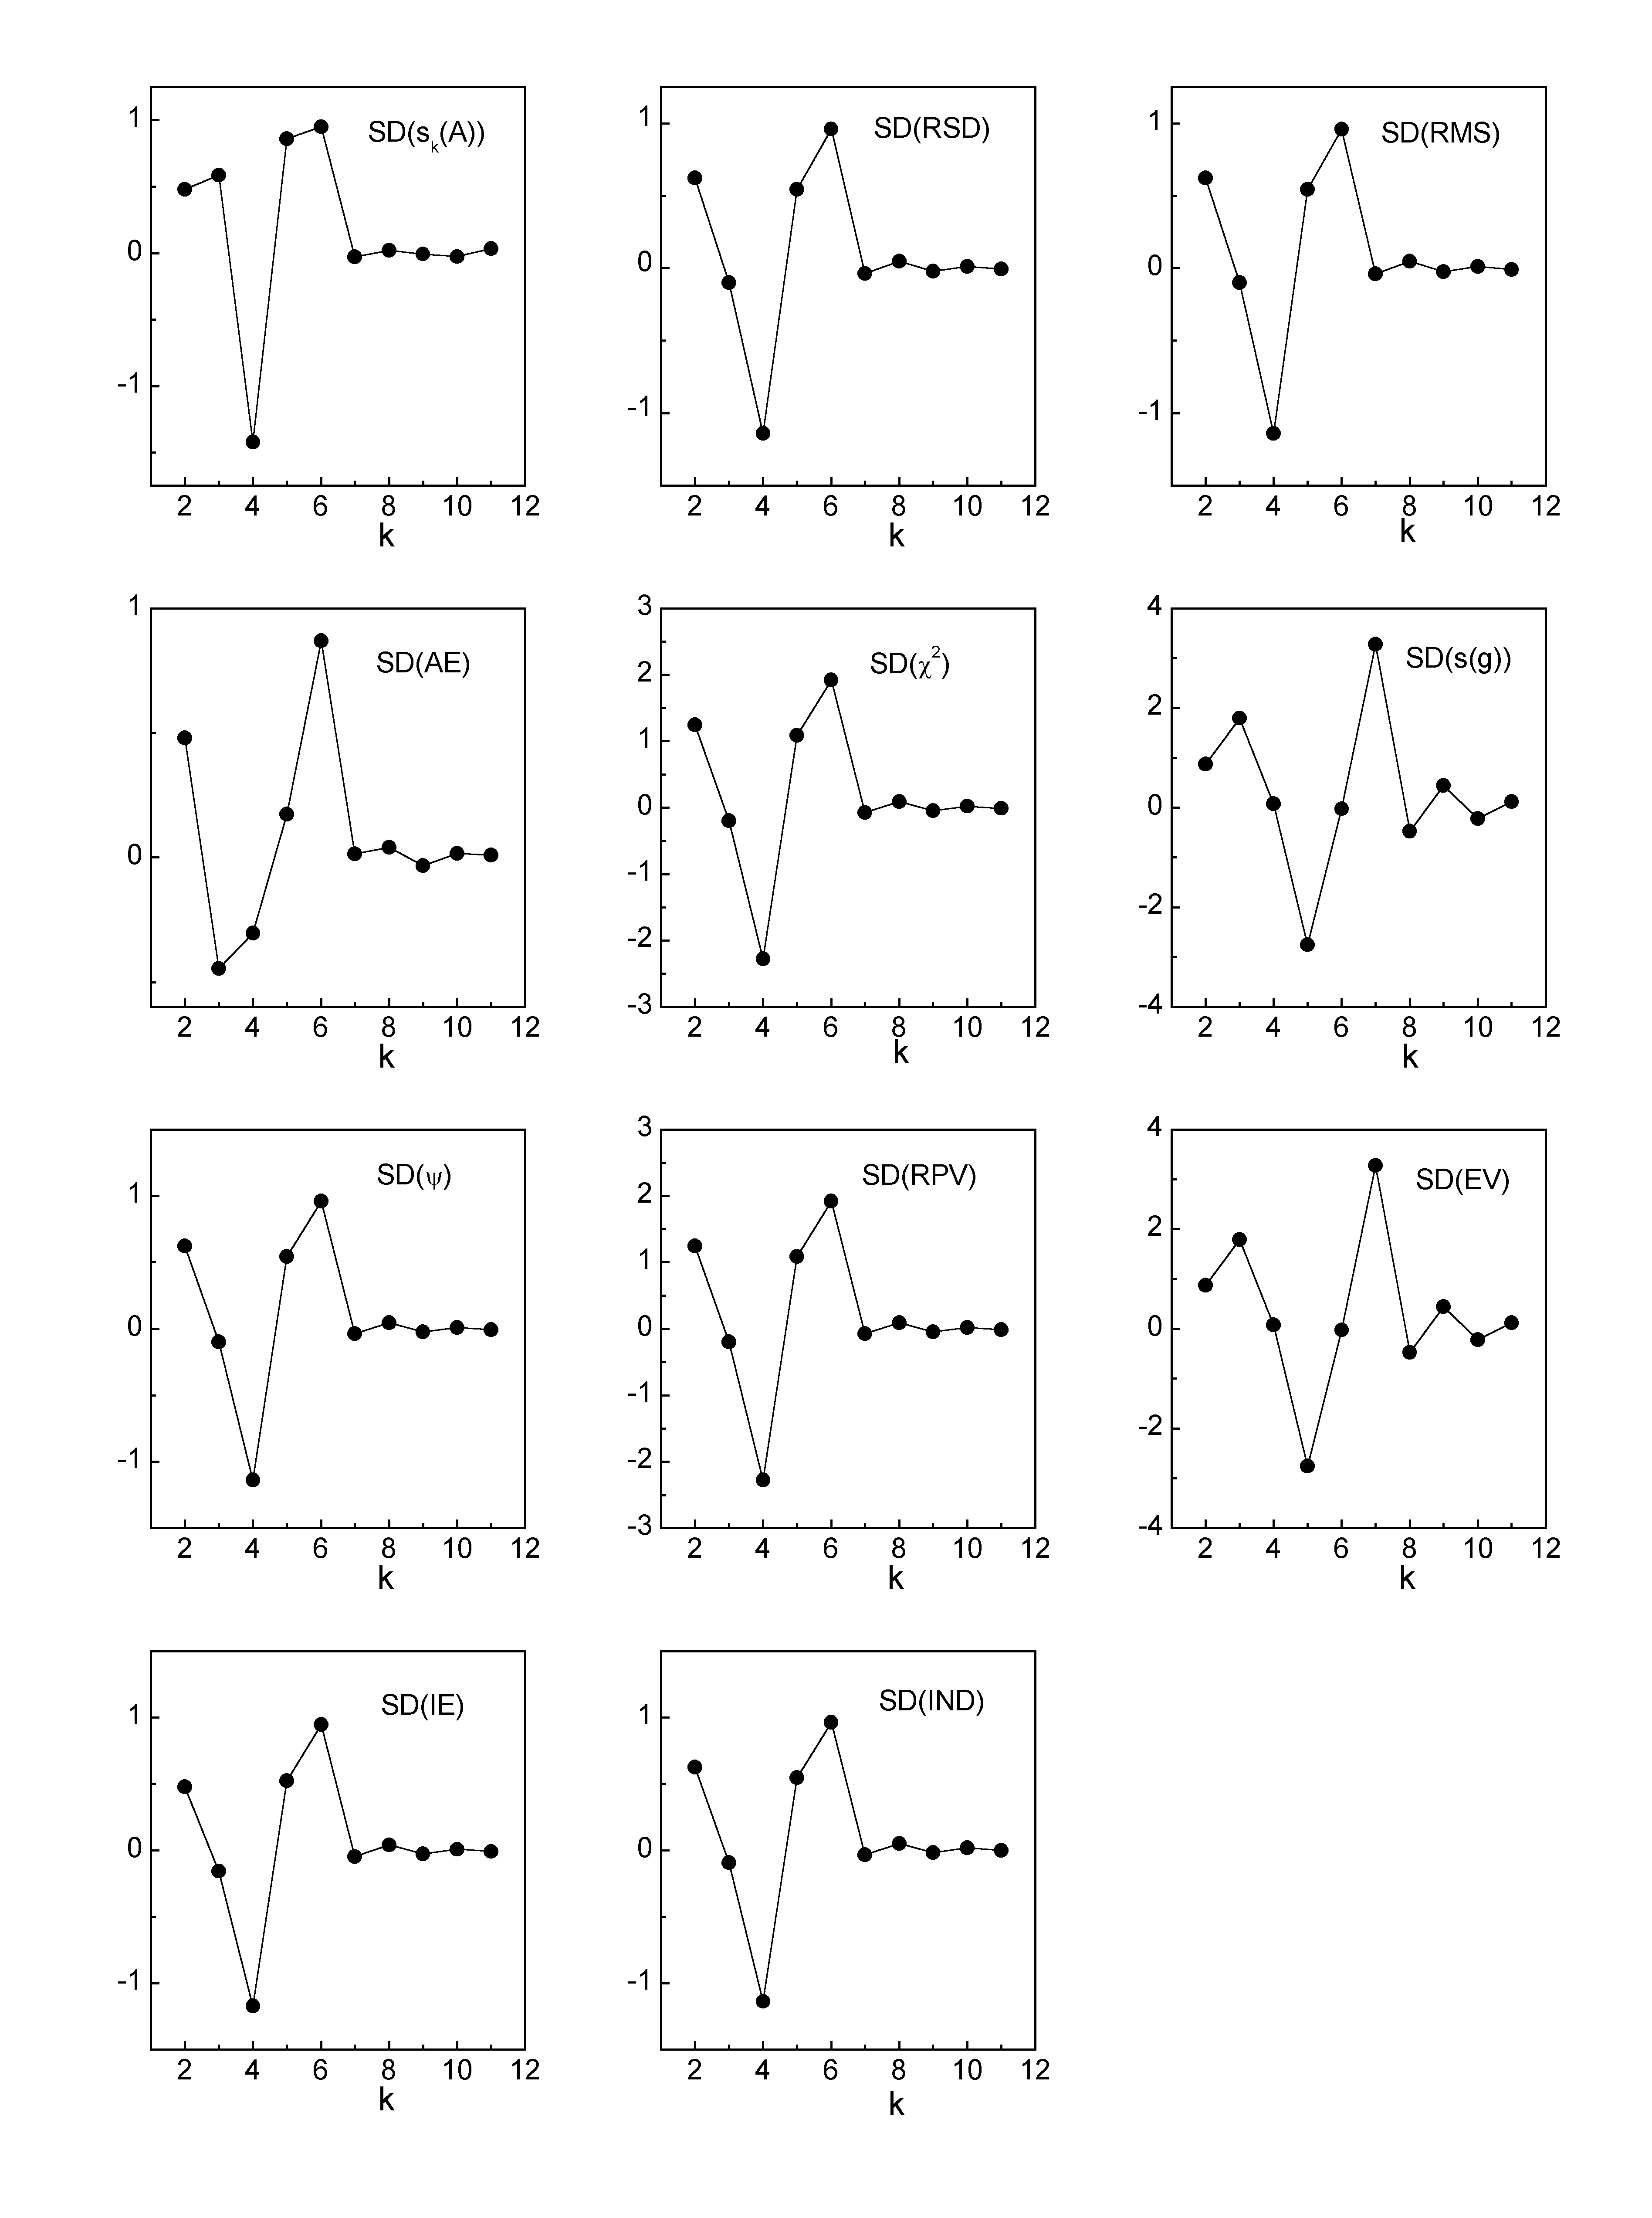
| Fig. 6 The second derivative detection criterium applied on 11 indices methods descibed on Fig. 3. | |
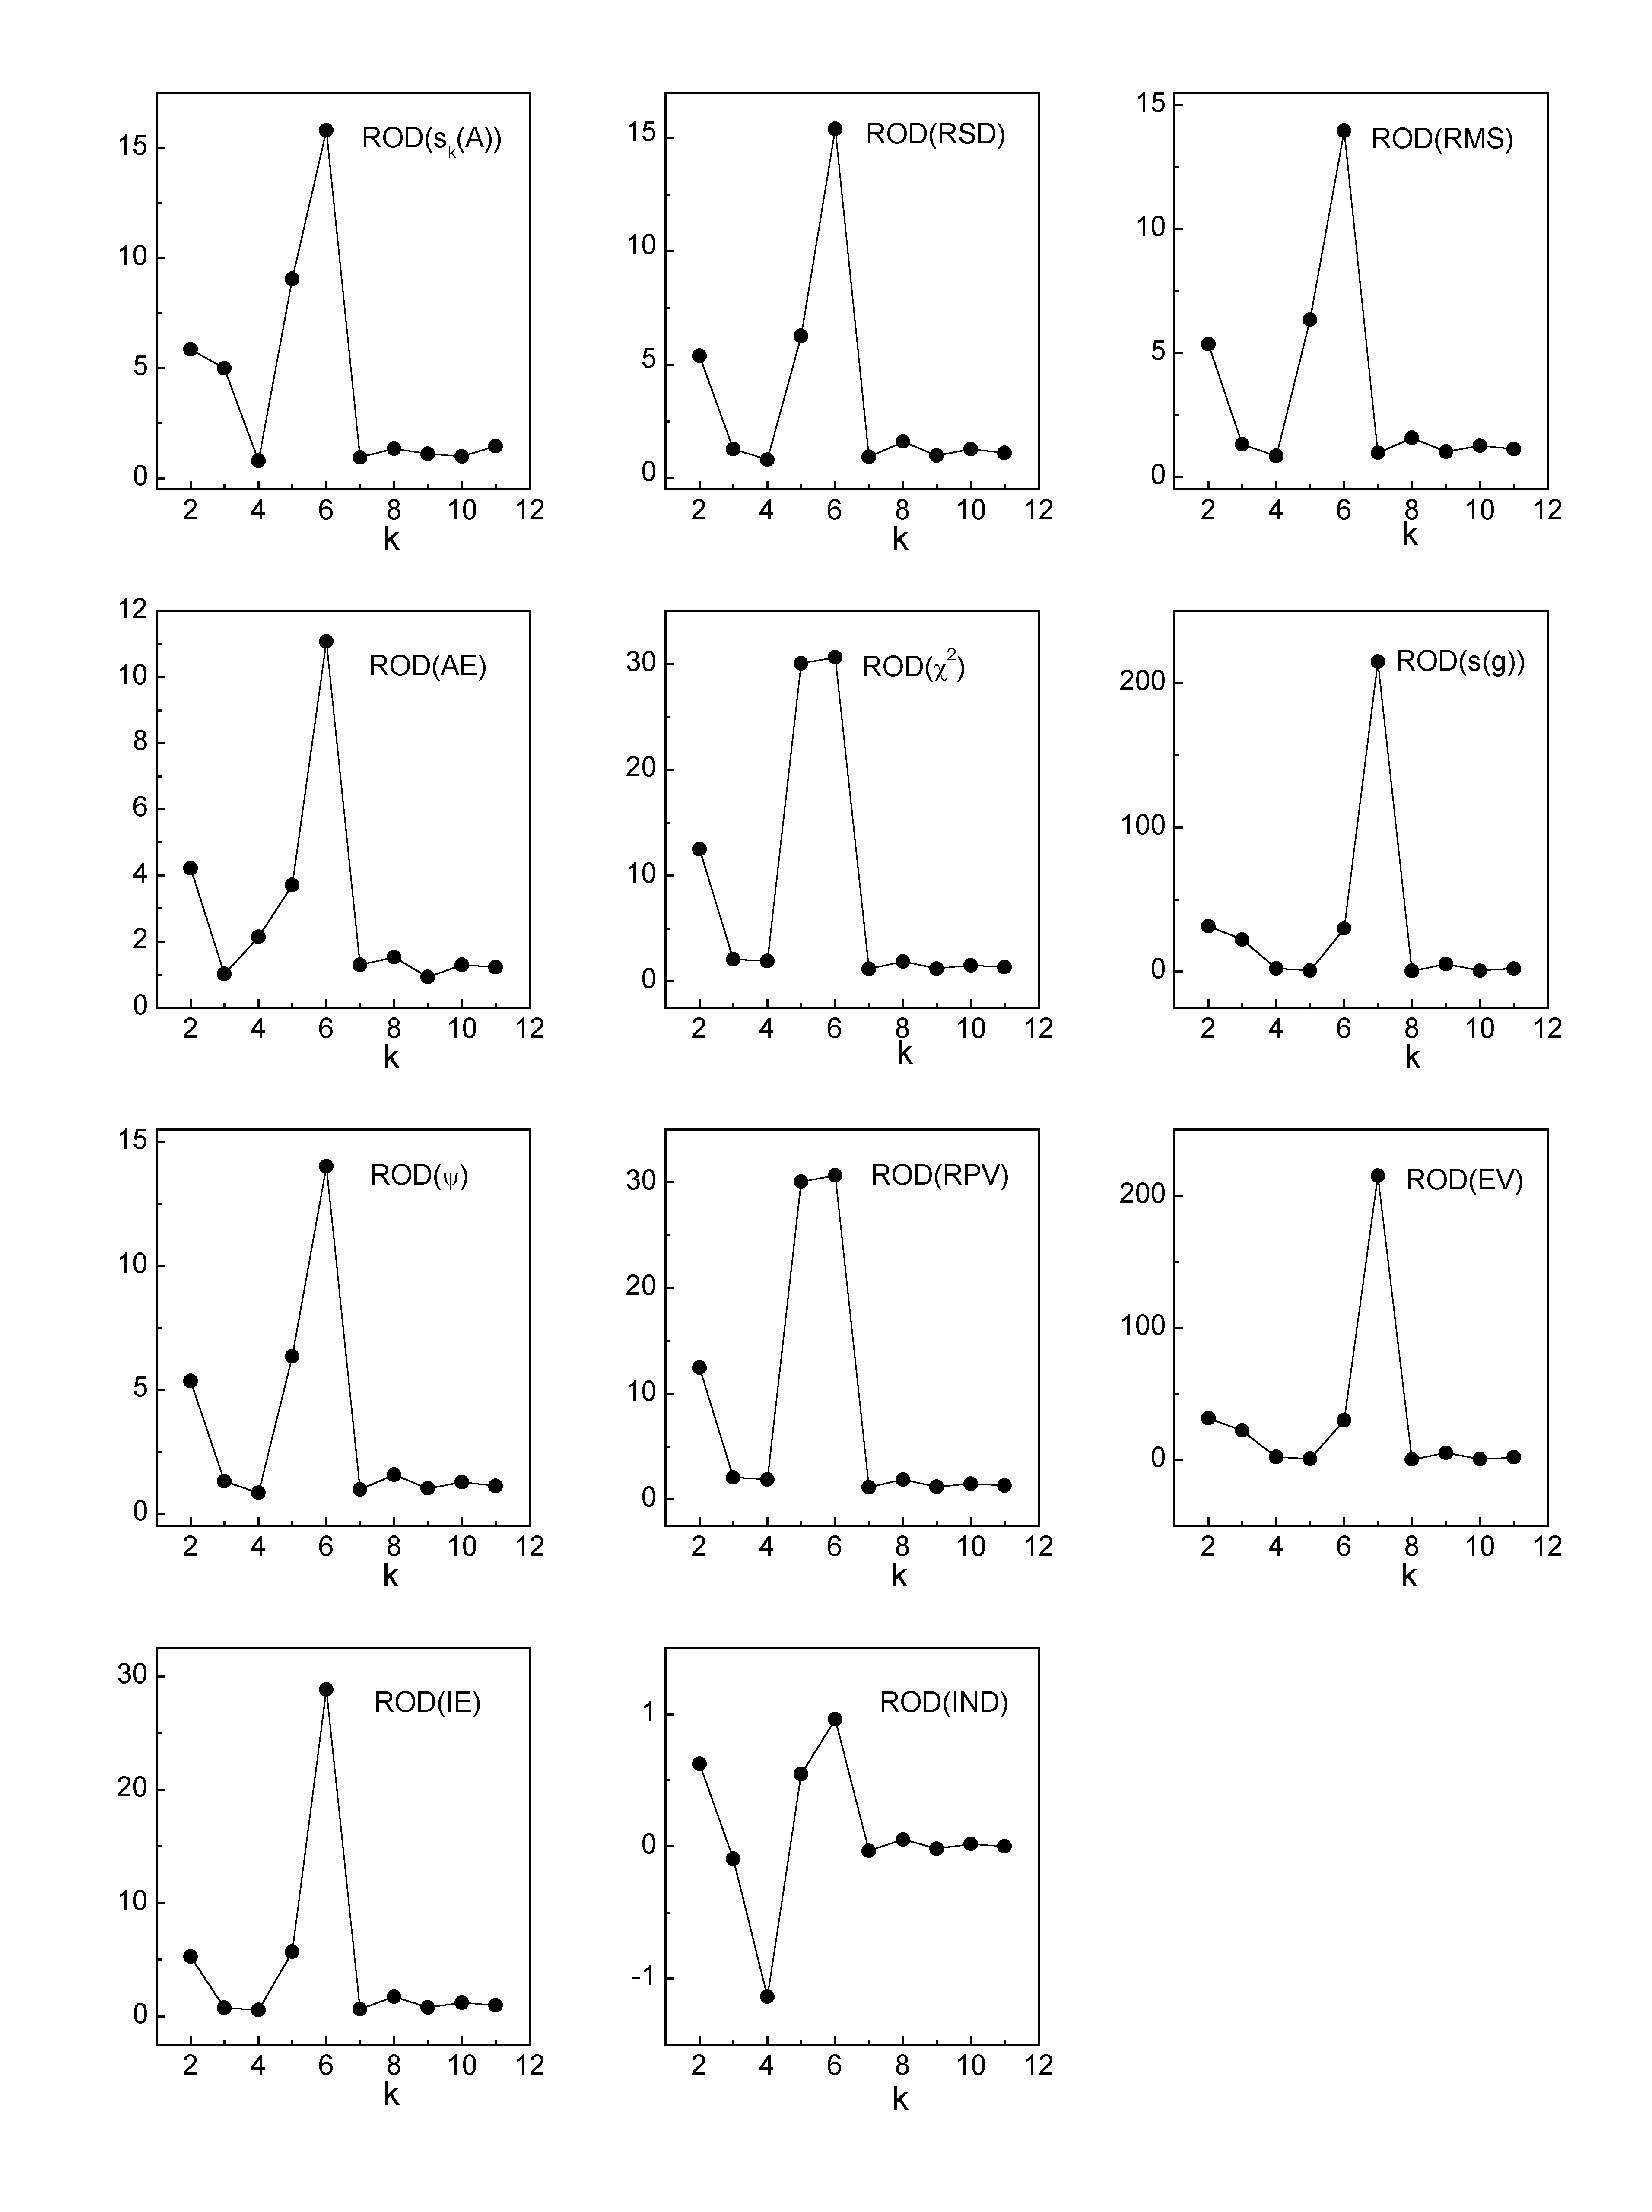
| Fig. 7The ratio of derivatives detection criterium applied on 11 indices methods descibed on Fig. 3. |